Teaching:TUW - UE InfoVis WS 2005/06 - Gruppe 10 - Aufgabe 2
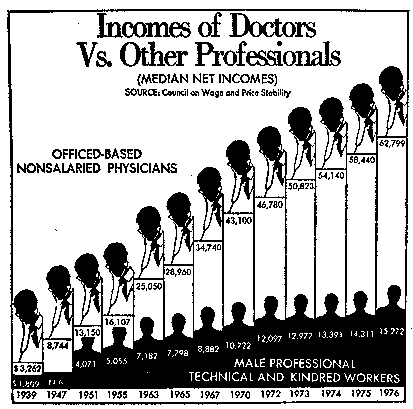
Poor Graphic

Drawbacks
- Lie Factor: non-linear time scale shows a linear growth of the salary, but it's exponential,
- Bad Data-Ink-Ratio: a lot of ink is used to differ the bars and for
- Chart Junk: pictures of the doctors and other professionals, year is always written with 4-digits,
- Bad aesthetic: graphic has a bad usability (difficult to read) because of chart-junk, lie-factors and no use of colors.
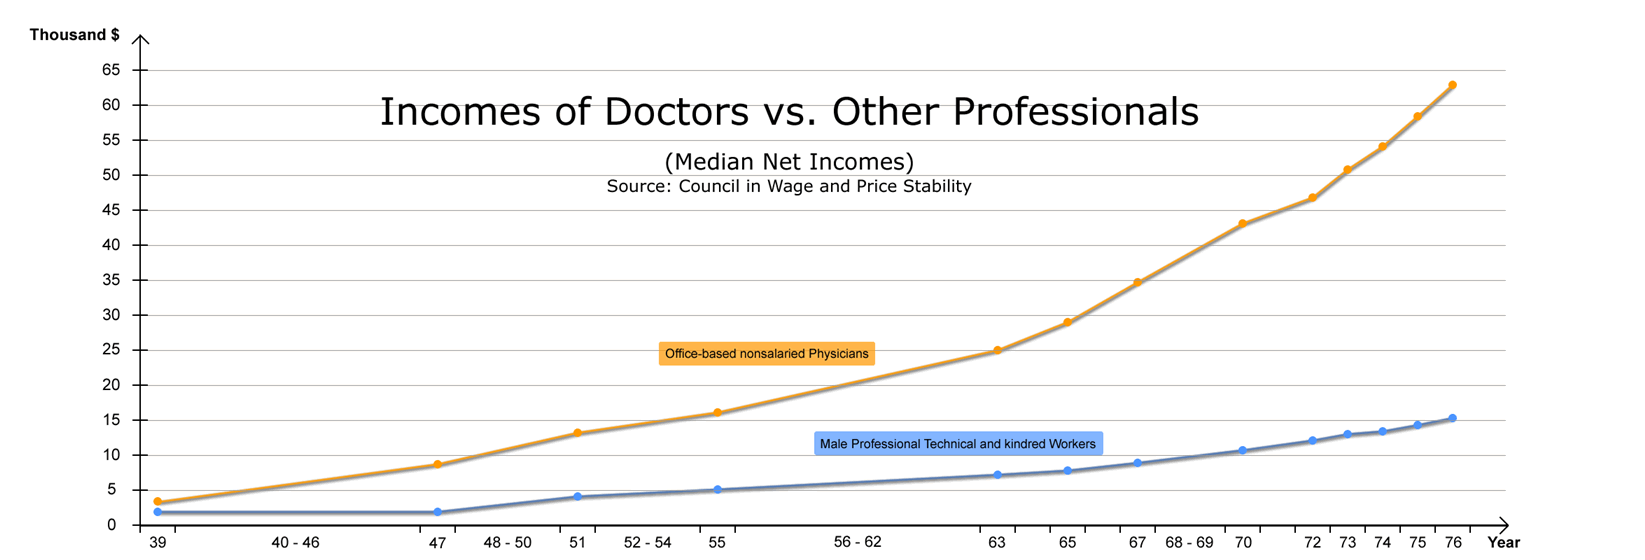
Improvements
- Used a linear time scale to show the exponential growth,
- Additional usage of a line chart to better visualize the higher growth of doctors salary,
- Removed the chart junk (pictures of doctors and other professionals, and 4-digit years) which results in a better data-ink-ratio,
- Grouped the legend into a single block,
- Added a y-axis scale on both sides, because of the high width of the new graphic,
- improved Aesthetic-Usability Effect due to usage of colors.
Redesigned Graphic
