Teaching:TUW - UE InfoVis WS 2005/06 - Gruppe 09 - Aufgabe 2
Poor Graphic

Drawbacks
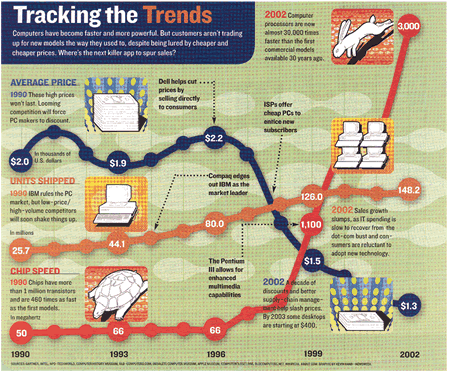
- Bad Data-ink ratio: There are a couple of elements which are not important or even warping to the graph, like: the background pattern (image), the images showing the development. These just overload the graph, so without them, the graph would be a lot simpler, and clearer. /n Using nearly the same color for two different data sources (Units shipped & Chip speed) can be obscuring and misguiding.
Correction
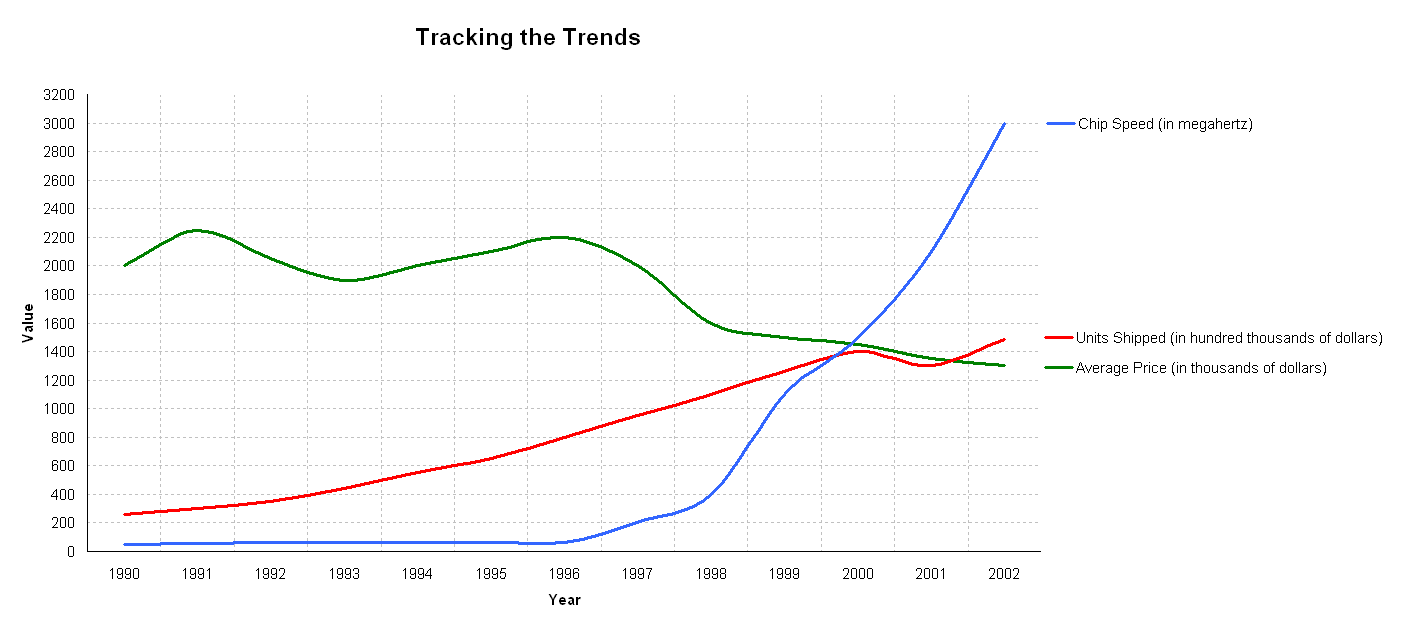
Redesigned Graphic
