Teaching:TUW - UE InfoVis WS 2005/06 - Gruppe 09 - Aufgabe 2: Difference between revisions
Jump to navigation
Jump to search
| Line 4: | Line 4: | ||
== Drawbacks == | == Drawbacks == | ||
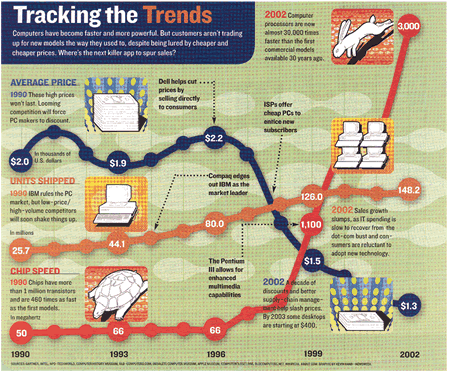
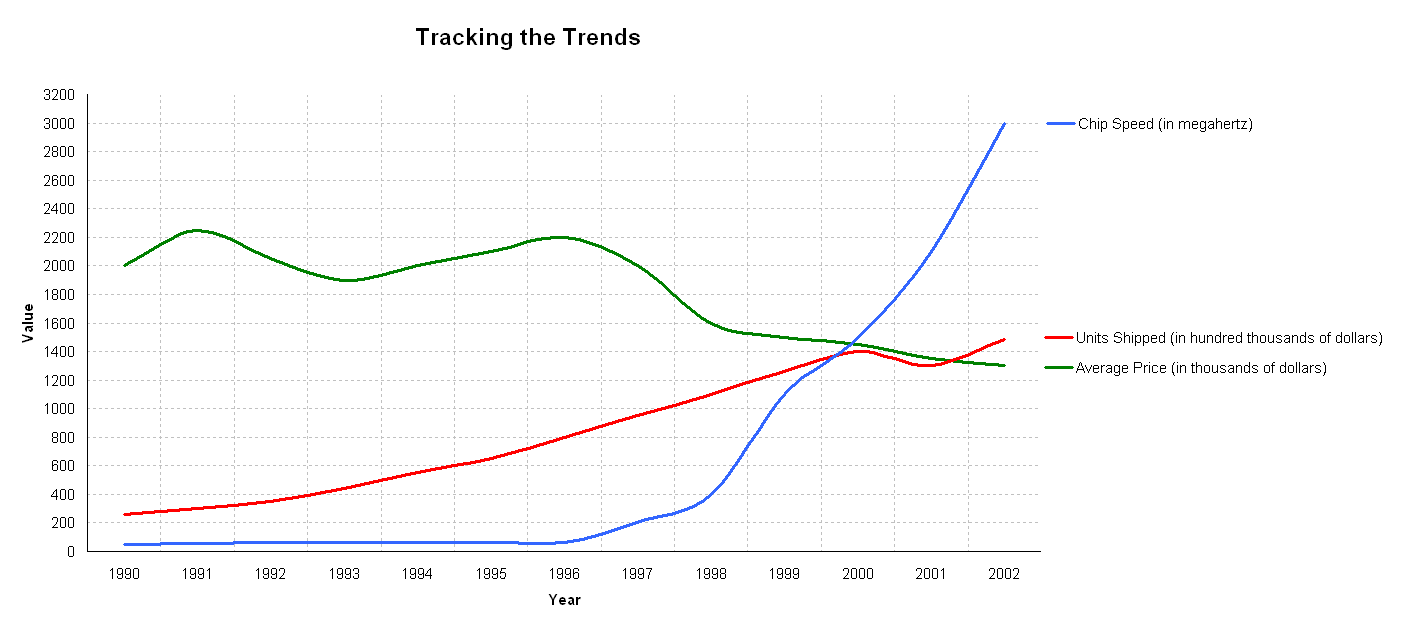
* Bad Data-ink ratio: There are a couple of elements which are not important to the graph, like: the background pattern (image), the images showing the development. These just overload the graph, so without them, the graph would be a lot simpler, and clearer. | * Bad Data-ink ratio: There are a couple of elements which are not important or even warping to the graph, like: the background pattern (image), the images showing the development. These just overload the graph, so without them, the graph would be a lot simpler, and clearer. | ||
* | |||
== Correction == | == Correction == | ||
Revision as of 14:36, 3 November 2005
Poor Graphic

Drawbacks
- Bad Data-ink ratio: There are a couple of elements which are not important or even warping to the graph, like: the background pattern (image), the images showing the development. These just overload the graph, so without them, the graph would be a lot simpler, and clearer.
Correction
Redesigned Graphic
