Teaching:TUW - UE InfoVis WS 2005/06 - Gruppe 01 - Aufgabe 2: Difference between revisions
Jump to navigation
Jump to search
m (→Drawbacks) |
|||
| Line 2: | Line 2: | ||
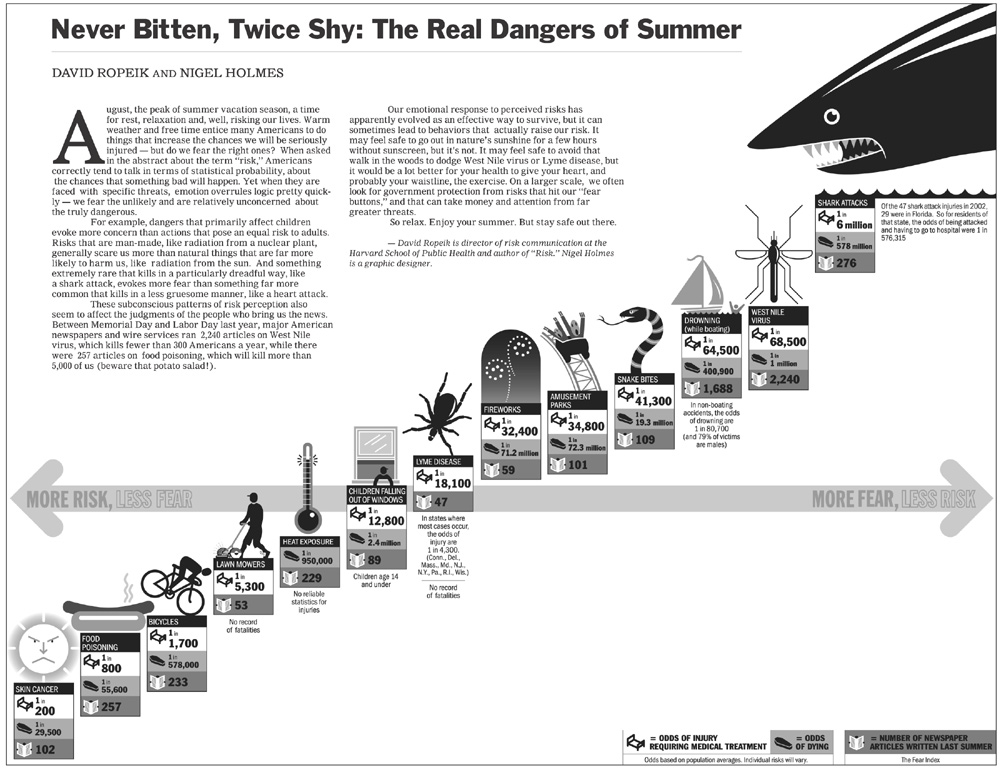
[[Image:Ropeik03neverbitten.jpg|none|thumb|600px|Never Bitten, Twice Shy: The Real Dangers of Summer (click on image for larger version)]] | [[Image:Ropeik03neverbitten.jpg|none|thumb|600px|Never Bitten, Twice Shy: The Real Dangers of Summer (click on image for larger version)]] | ||
== | == New Graphic == | ||
== Poor Graphic == | |||
[[Image:medical.jpg|none|thumb|400px|Required medical treatment view (click on image for larger version)]] | |||
== Poor Graphic == | |||
[[Image:dying.jpg|none|thumb|400px|Dying case view (click on image for larger version)]] | |||
== Poor Graphic == | |||
[[Image:article.jpg|none|thumb|400px|Written article view (click on image for larger version)]] | |||
Revision as of 03:05, 4 November 2005
Poor Graphic
