Uploads by Iwolf
Jump to navigation
Jump to search
This special page shows all uploaded files.
| Date | Name | Thumbnail | Size | Description | Versions |
|---|---|---|---|---|---|
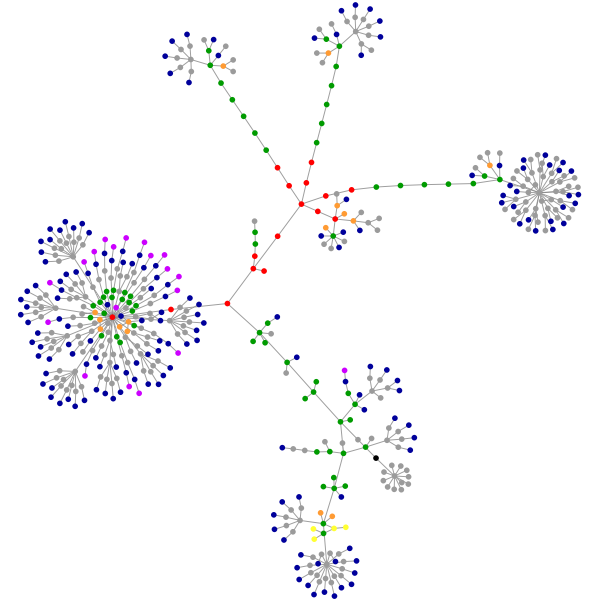
| 11:57, 29 May 2006 | Aharef06websitegraph.png (file) |  |
95 KB | Websites as graphs (http://www.infovis-wiki.net) | 1 |
| 12:36, 4 October 2005 | Aigner03infovis ue.gif (file) |  |
5 KB | Logo of the Lecture "Informationsvisualisierung" | 1 |
| 10:45, 4 October 2005 | Aigner04carevis.gif (file) |  |
30 KB | CareVis application window - Interactive Visualization Methods to Support Protocol-Based Care | 1 |
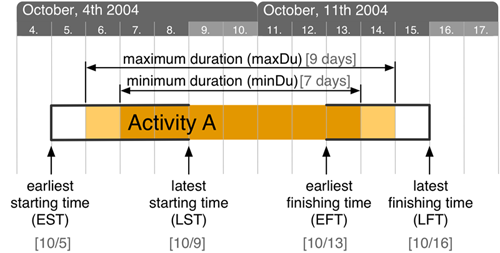
| 14:15, 3 October 2005 | Aigner05planningline-model.png (file) |  |
38 KB | 2 | |
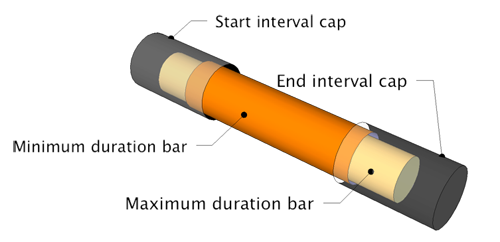
| 14:08, 3 October 2005 | Aigner05planningline.png (file) |  |
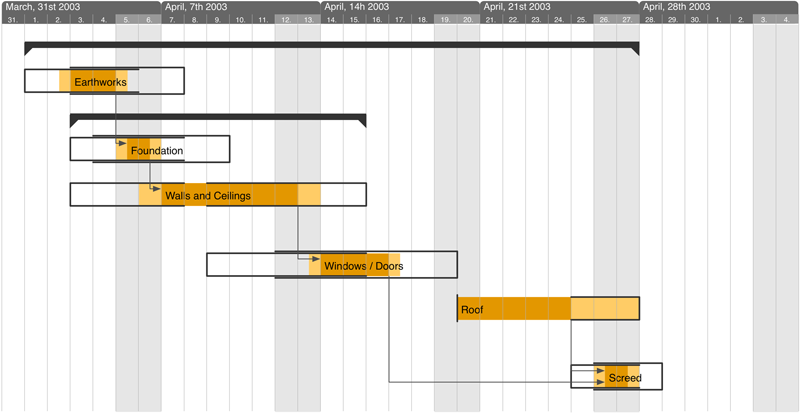
41 KB | PlanningLine glyph and represented time attribues | 1 |
| 14:09, 3 October 2005 | Aigner05planninglines-plan.png (file) |  |
35 KB | Example project plan using PlanningLines | 1 |
| 17:32, 4 December 2006 | Aigner 2006 wikiposium infovis-wiki.pdf (file) | 1.93 MB | Slides of InfoVis:Wiki presentation at Wikiposium 2006 | 1 | |
| 10:40, 19 October 2010 | Akpeters10idvbook.jpg (file) |  |
3 KB | Book Cover of Ward, M. and Grinstein, G. and Keim, D.: Interactive Data Visualization: Foundations, Techniques, and Application | 1 |
| 16:41, 29 November 2006 | Beautiful-evidence.jpg (file) |  |
48 KB | Book Cover of Tufte, E.R.: Beautiful Evidence, Graphics Press, 2006 | 1 |
| 20:27, 2 March 2012 | Beautiful-visualization.jpg (file) |  |
164 KB | Book Cover "Beautiful Visualization" | 1 |
| 11:52, 12 September 2005 | Bier93magiclens.gif (file) |  |
5 KB | Example for the use of Magic Lenses applied to a 3D model of a bridge<br> *Wireframe Lens (rectangular) *2D Magnifier Lens (circular) *+ their combination (magnified wireframe) | 1 |
| 02:16, 13 June 2005 | Book-envisioning information.jpg (file) |  |
32 KB | Book Cover "Tufte, Envisioning Information" | 1 |
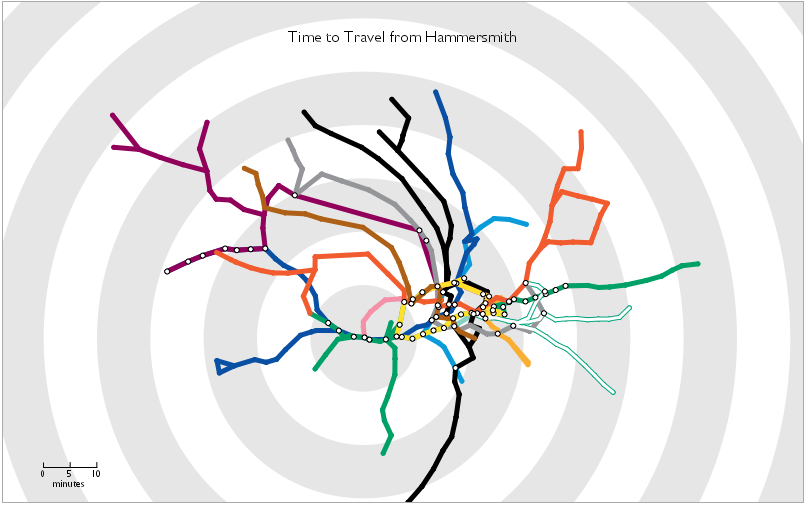
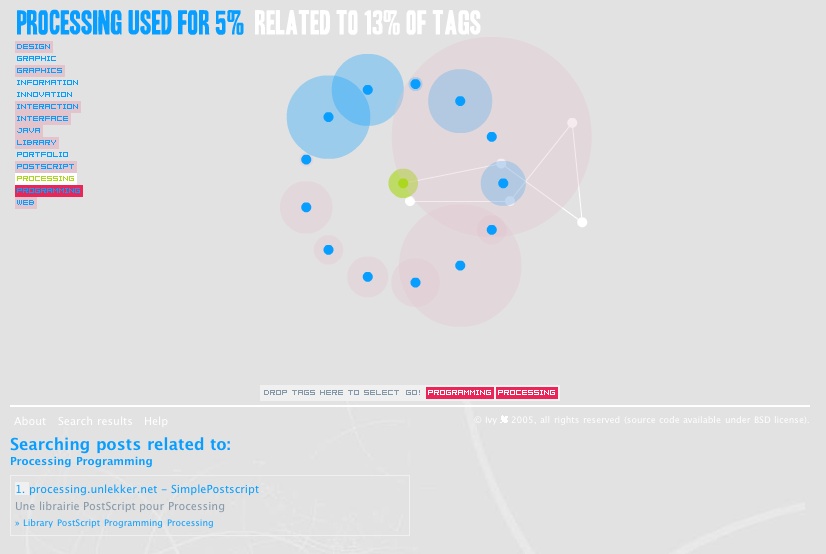
| 17:51, 25 January 2006 | Carden06travel time tube map.png (file) |  |
97 KB | Travel Time Tube Map - Screenshot of an [http://www.processing.org processing] Applet that distorts the London underground network circularly according to travel times from a selected station. | 1 |
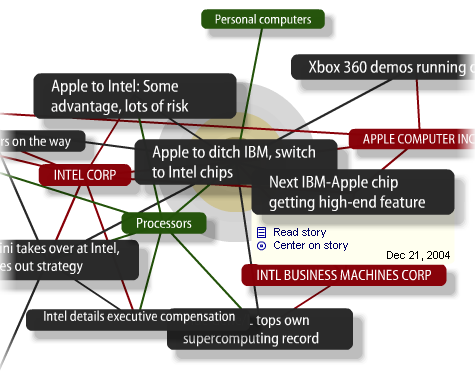
| 09:40, 4 October 2005 | Cnet05thebigpicture-detail.png (file) |  |
70 KB | '''The Big Picture''' - Ontology viewer that connects stories, companies, and topics within the News.com website. | 1 |
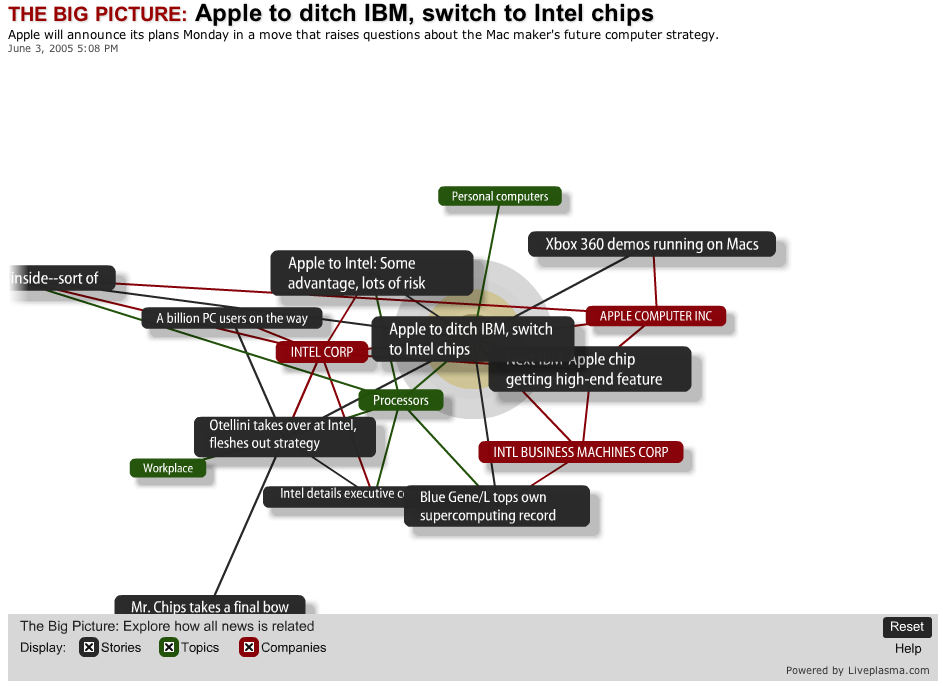
| 09:40, 4 October 2005 | Cnet05thebigpicture.png (file) |  |
117 KB | '''The Big Picture'' - Ontology viewer that connects stories, companies, and topics within the News.com website. | 1 |
| 01:41, 19 July 2005 | Delicious treemap.gif (file) |  |
85 KB | Treemap representation of del.icio.us bookmarks | 1 |
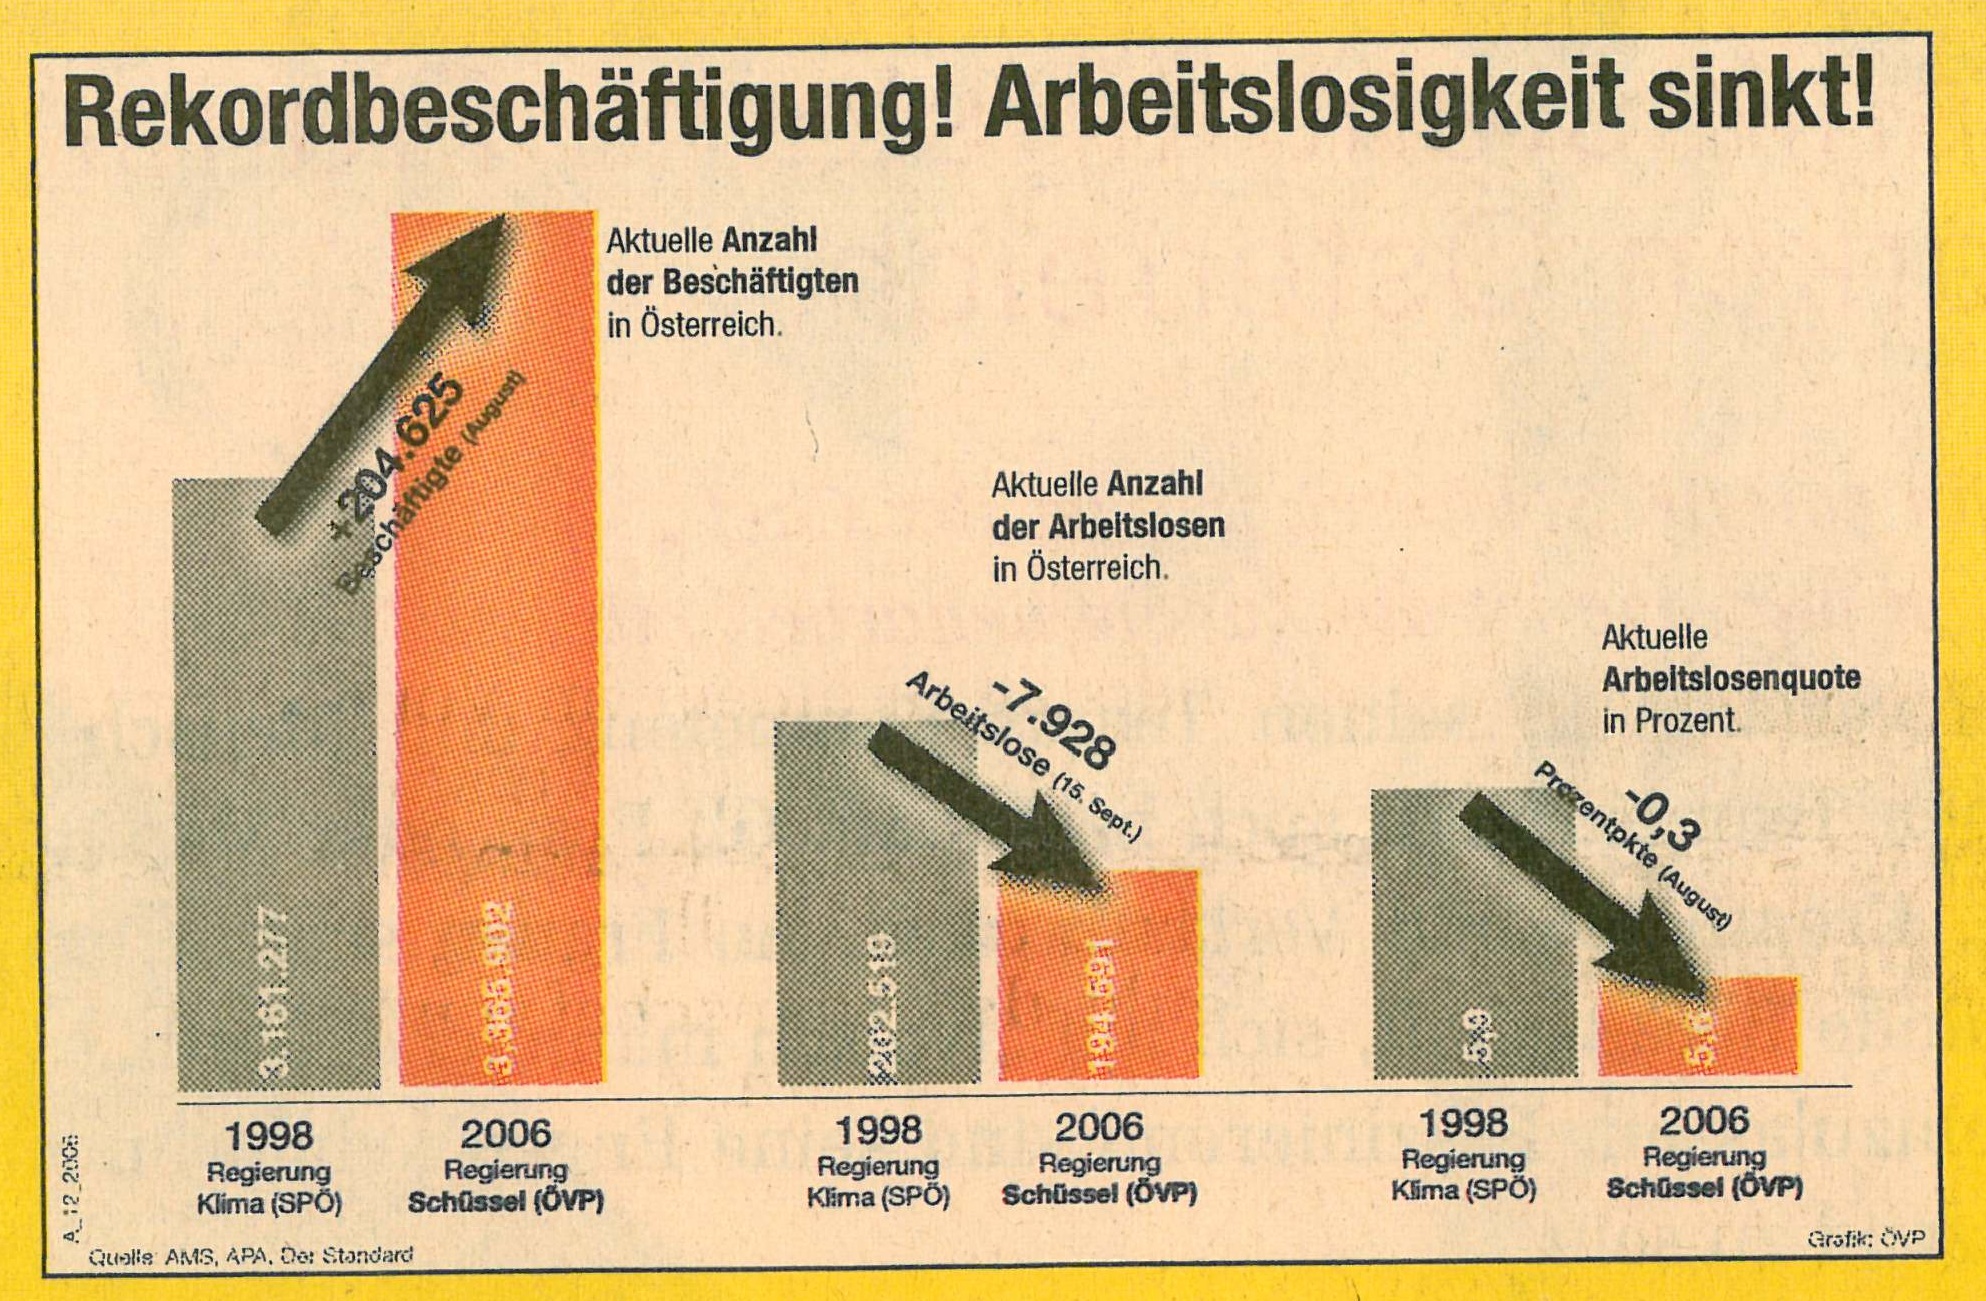
| 10:53, 24 October 2006 | Derstandard06rekordbeschaeftigung.jpg (file) |  |
821 KB | Rekordbeschäftigung! Arbeitslosigkeit sinkt! | 1 |
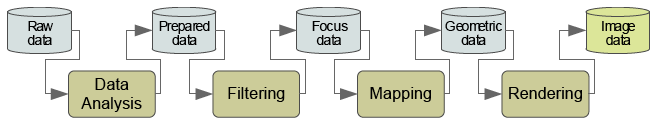
| 14:36, 8 May 2006 | Dossantos04vis pipeline.png (file) | 15 KB | The visualization pipeline describes the process of creating visual representations of data. | 1 | |
| 16:37, 19 October 2006 | Duk-logo 250x250.png (file) | 5 KB | Logo of Danube University Krems | 1 | |
| 09:59, 29 July 2008 | Elsevier08ware-visual-thinking.jpg (file) |  |
323 KB | Book Cover "Visual Thinking for Design - Colin Ware" | 1 |
| 15:55, 15 February 2007 | Engelhardt07infovis-diagram.gif (file) |  |
132 KB | The Infovis diagram. | 1 |
| 11:18, 9 October 2007 | Fayyad96kdd-process.png (file) |  |
83 KB | An Overview of the Steps That Compose the KDD Process | 1 |
| 09:46, 25 October 2005 | Few04tracking-trends.gif (file) | 116 KB | Infographic "Tracking the Trends" | 1 | |
| 09:45, 25 October 2005 | Few05snowfall.gif (file) |  |
67 KB | Map of Idaho Ski Resort Annual Snowfall | 1 |
| 15:49, 10 April 2012 | Flowingdata2012visualizethis.png (file) |  |
111 KB | [FlowingData, 2012] Nathan Yau, FlowingData, Retrieved at: April 10, 2012. http://book.flowingdata.com/ | 1 |
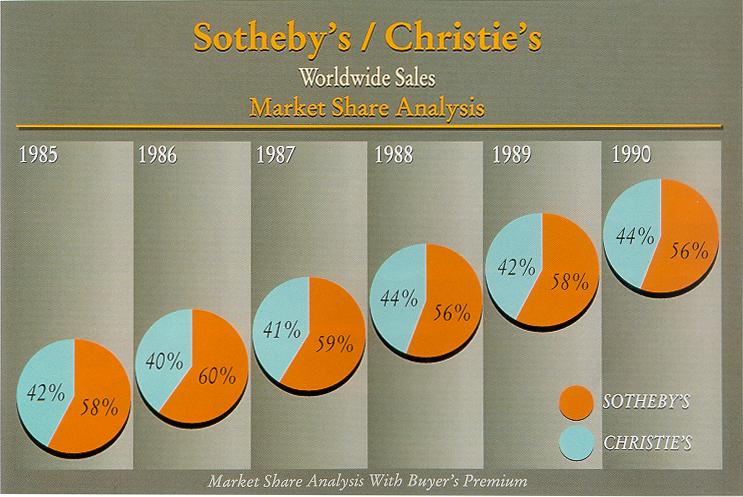
| 10:54, 24 October 2006 | Friendly00sothebys.jpg (file) |  |
57 KB | Sotheby's / Christie's Worldwide Sales Market Share Analysis | 1 |
| 09:47, 25 October 2005 | Friendly02doctors.gif (file) |  |
10 KB | Bar Chart of "Incomes of Doctors Vs. Other Professionals" | 1 |
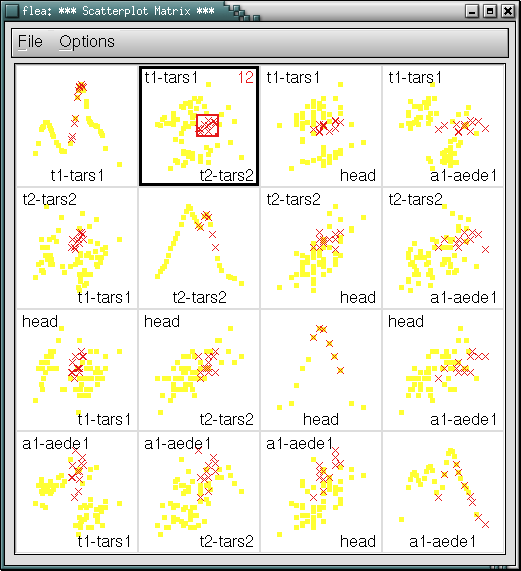
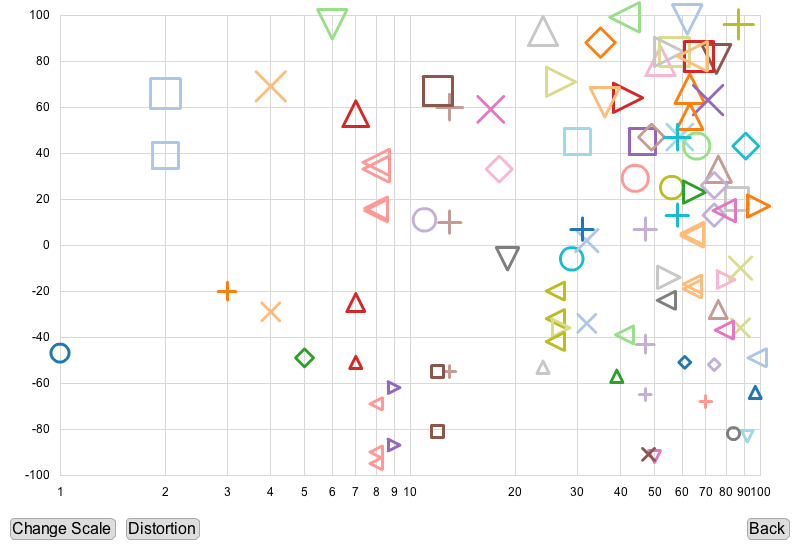
| 10:49, 13 October 2005 | Ggobi04brushlink.png (file) |  |
17 KB | Linking and brushing in a scatterplot matrix (image created with [http://www.ggobi.org GGobi] [Voigt, 2002] | 1 |
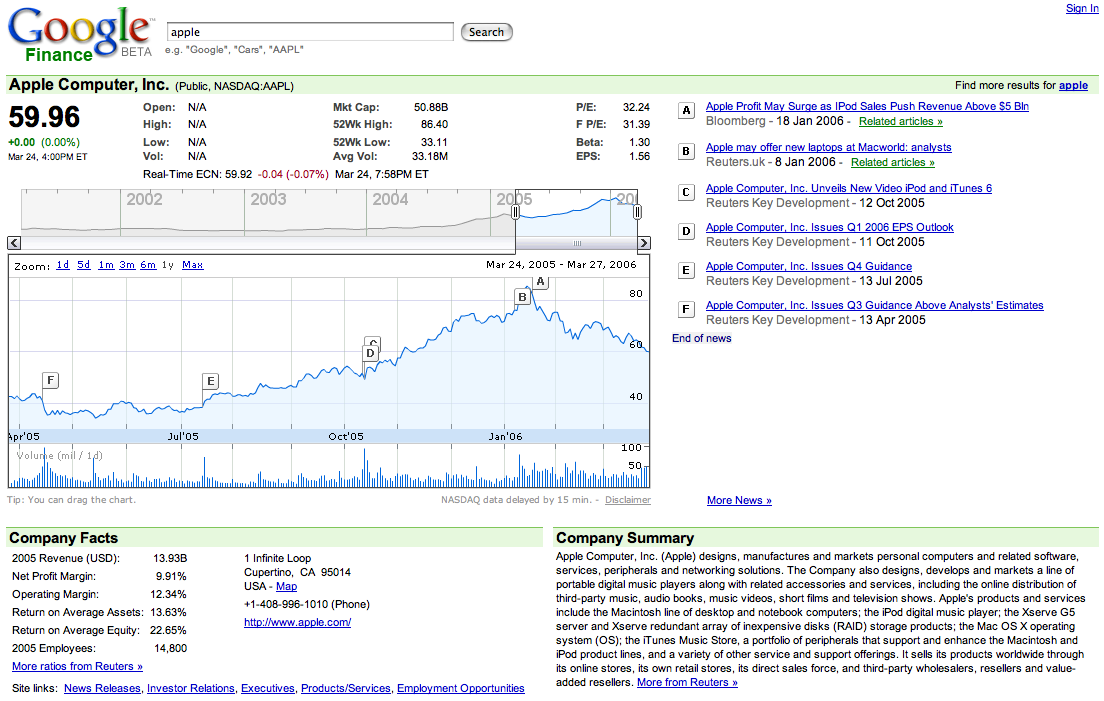
| 10:53, 27 March 2006 | Google06finance.png (file) |  |
170 KB | Interactive Flash graphs to explore stock price data from Google Finance. | 1 |
| 11:31, 5 December 2007 | Heer07flare.png (file) |  |
47 KB | Example of [http://flare.prefuse.org/ the flare visualization toolkit] | 1 |
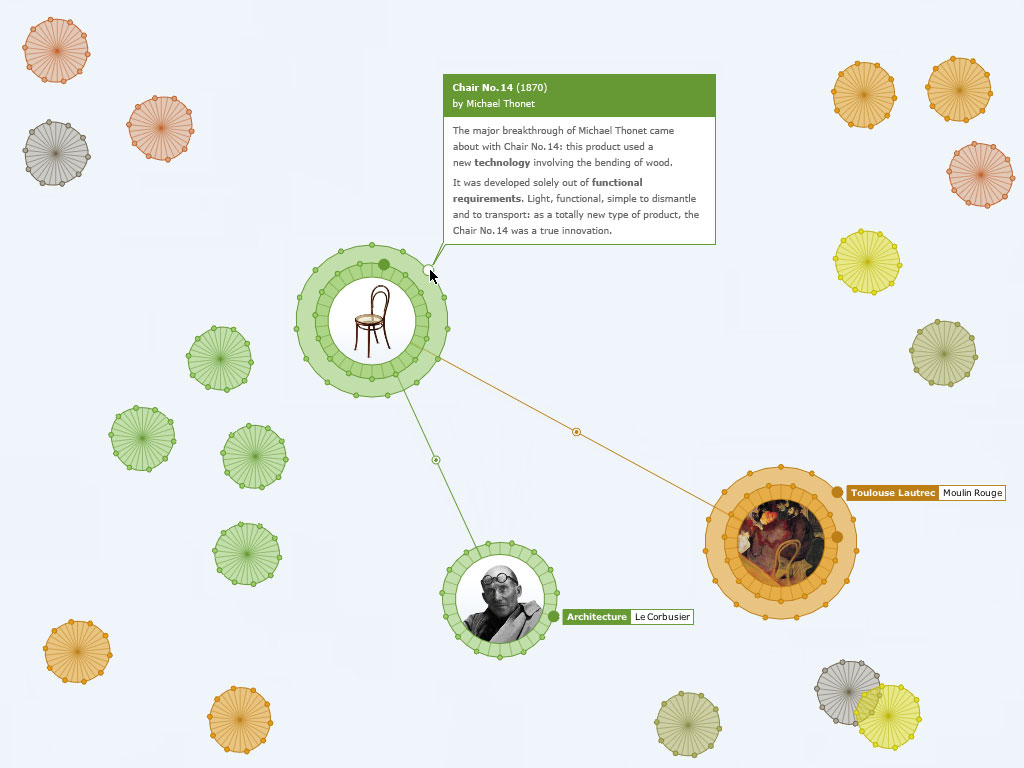
| 15:05, 29 November 2005 | Horn05jellyfish.jpg (file) |  |
92 KB | Jellyfish visualizes an encyclopedia of the arts. The application is developed in Processing and uses an XML-database to update content. | 1 |
| 03:39, 21 July 2005 | Ieg logo.gif (file) | 10 KB | Information Engineering Group | 1 | |
| 03:42, 21 July 2005 | Ieg logo small.gif (file) | 2 KB | Information engineering Group | 1 | |
| 16:05, 19 October 2006 | Ike-logo-schrift 385x35.png (file) | 8 KB | IKE Logo Department of Information and Knowledge Engineering, Danube University Krems | 1 | |
| 02:49, 21 July 2005 | In the news.gif (file) |  |
61 KB | In The News (Google News visualization) | 1 |
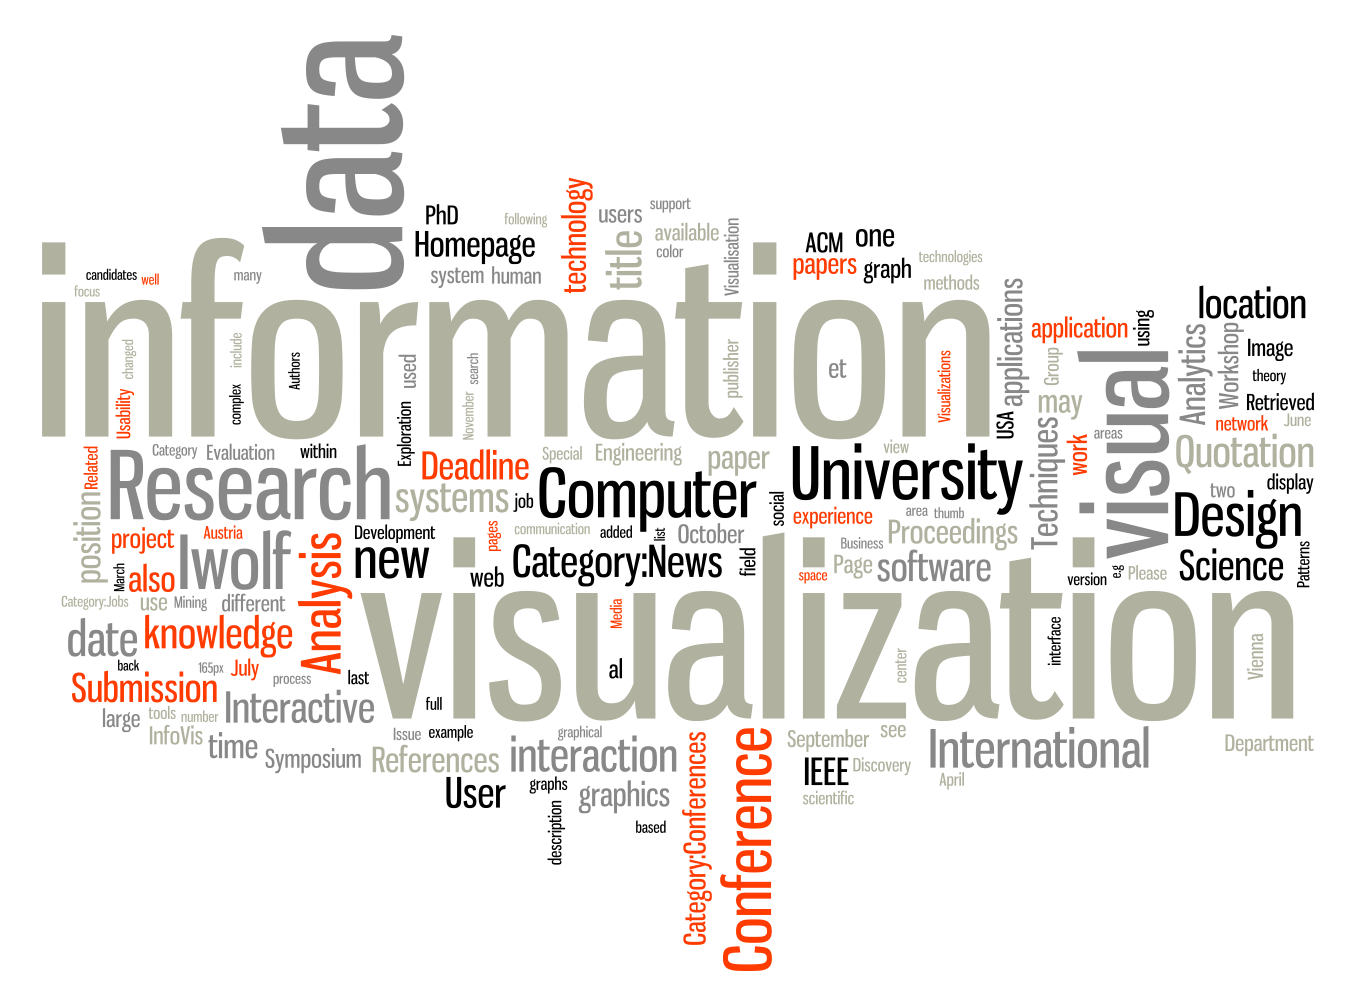
| 16:37, 27 August 2009 | Infovis-wiki tagcloud 20090827.png (file) |  |
291 KB | Wordle generated Tag Cloud of InfoVis Wiki content | 2 |
| 13:05, 3 July 2008 | Ivda fish-image web.jpg (file) |  |
20 KB | Goldfish jump | 1 |
| 15:08, 15 September 2005 | Ivy05revealicious.jpg (file) |  |
64 KB | '''SpaceNav''' (part of the ''Revealicious'' project) -- allows for visually exploring [http://del.icio.us/ del.icio.us] bookmarks. | 1 |
| 21:24, 29 September 2005 | Iwolf.jpg (file) |  |
4 KB | Wolfgang Aigner | 1 |
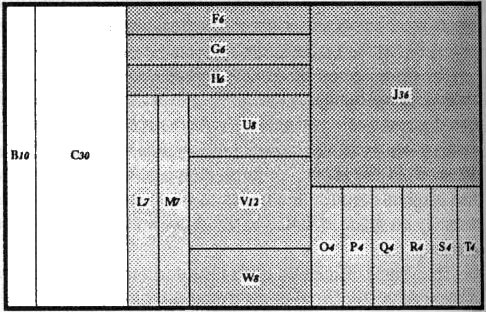
| 12:24, 3 October 2005 | Johnsonshneiderman91treemap.jpg (file) |  |
58 KB | Treemap example | 1 |
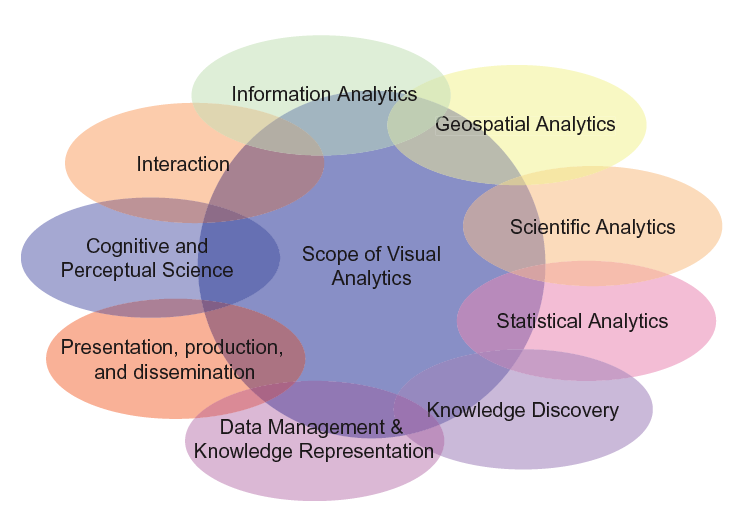
| 12:04, 31 August 2006 | Keim06visual-analytics-disciplines.png (file) |  |
61 KB | Visual analytics as a highly interdisciplinary field of research. | 1 |
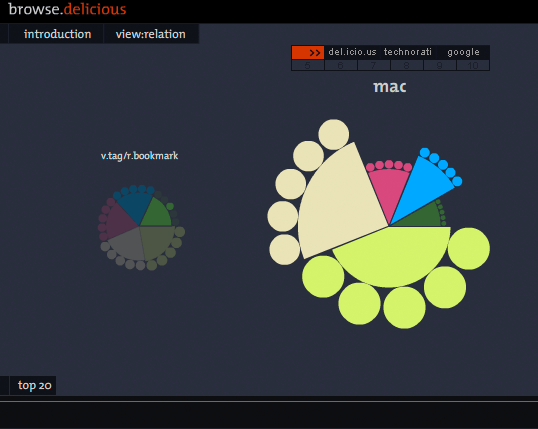
| 12:31, 17 October 2005 | Kormann05browsedelicious.png (file) |  |
52 KB | browse.delicious a visual browser to explore and experience the del.icio.us community network [Kormann, 2005] | 1 |
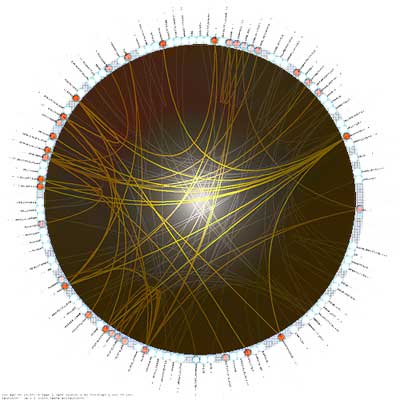
| 15:17, 24 August 2005 | Krzywinski04schemaball.jpg (file) |  |
23 KB | schemaball | 1 |
| 16:25, 24 August 2005 | Labescape05enterprise-treemap.gif (file) |  |
62 KB | Lab Escape | 1 |
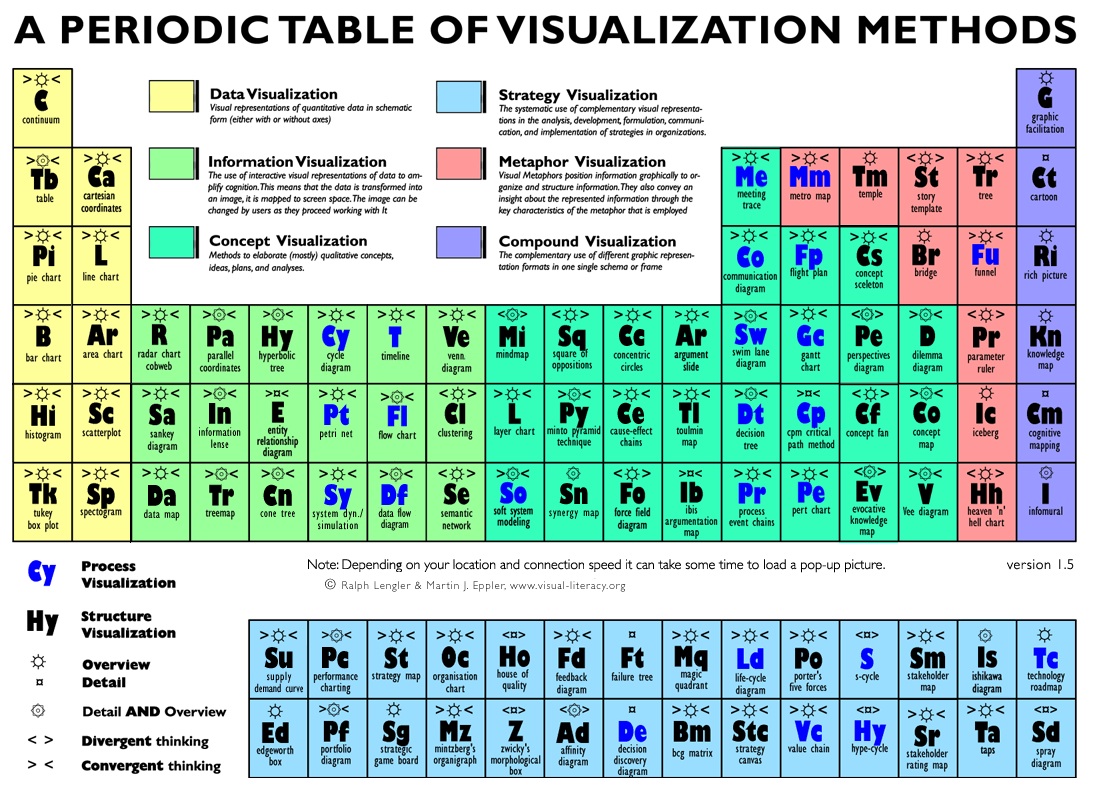
| 14:27, 1 March 2007 | Lengler07periodic-table.jpg (file) |  |
375 KB | A Periodic Table of Visualization Methods ([http://www.visual-literacy.org/periodic_table/periodic_table.html# interactive version]) | 1 |
| 13:30, 13 October 2005 | Leung94polyfocal.gif (file) |  |
113 KB | Polyfocal display [Leung and Apperley, 1994] | 1 |
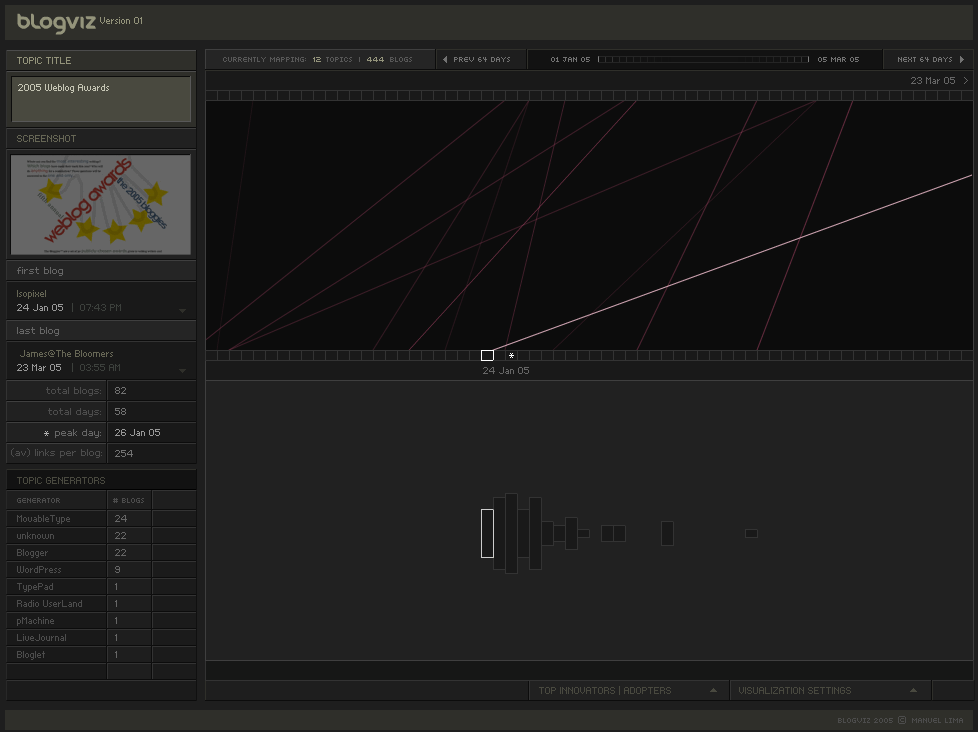
| 14:45, 18 October 2005 | Lima05blogviz.png (file) |  |
24 KB | blogviz - Mapping the dynamics of Information Diffusion in Blogspace | 1 |
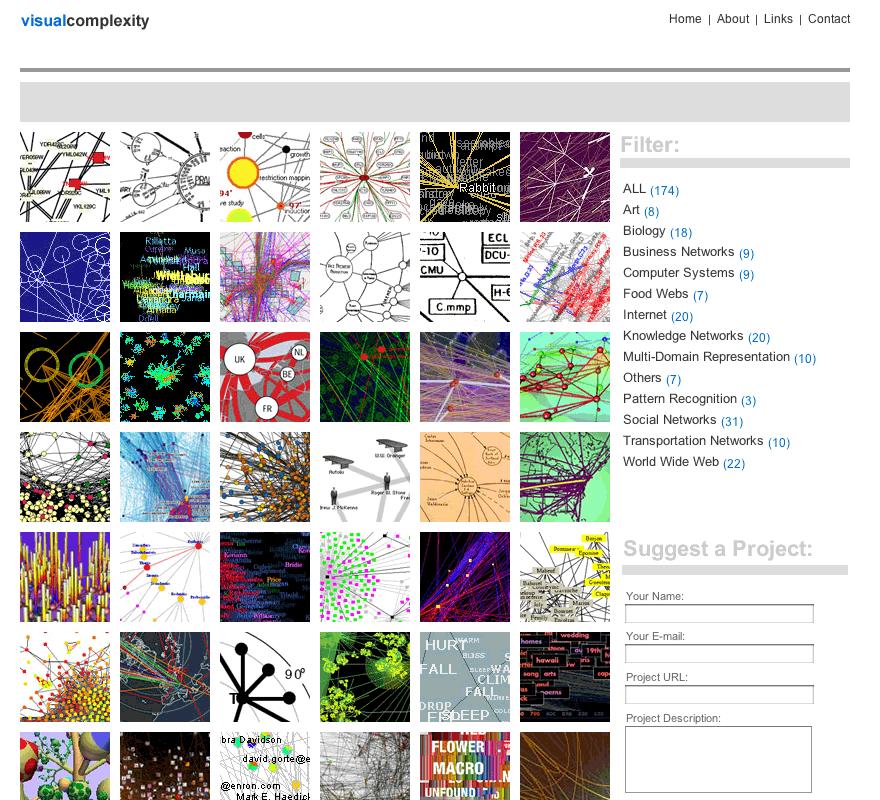
| 11:58, 17 October 2005 | Lima05visualcomplexity.png (file) |  |
181 KB | Screenshot of '''VisualComplexity.com''', a repository of complext network visualizations | 1 |
| 16:32, 19 February 2007 | Many-eyes07screenshot graph.gif (file) |  |
25 KB | Example of "Many Eyes" visualizaing social network data. | 1 |
| 16:27, 19 February 2007 | Manyeyes07logo.jpg (file) |  |
22 KB | Logo of "Many Eyes" | 1 |