Uploads by Iwolf
Jump to navigation
Jump to search
This special page shows all uploaded files.
| Date | Name | Thumbnail | Size | Description | Versions |
|---|---|---|---|---|---|
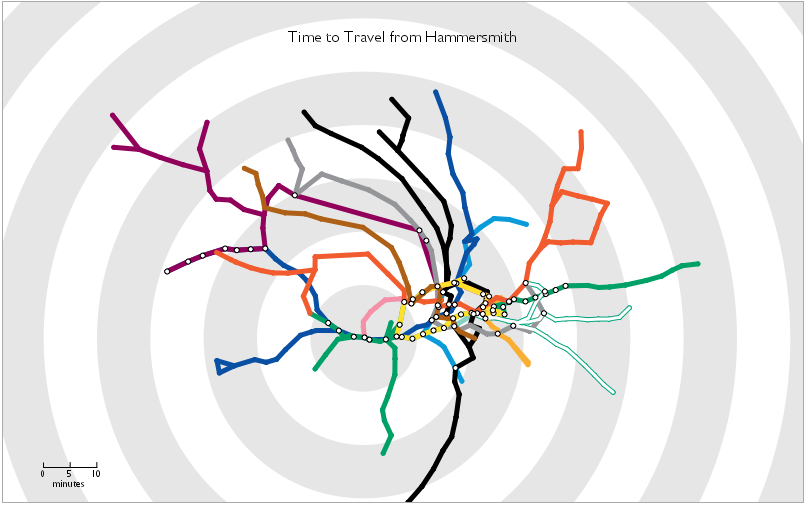
| 17:51, 25 January 2006 | Carden06travel time tube map.png (file) |  |
97 KB | Travel Time Tube Map - Screenshot of an [http://www.processing.org processing] Applet that distorts the London underground network circularly according to travel times from a selected station. | 1 |
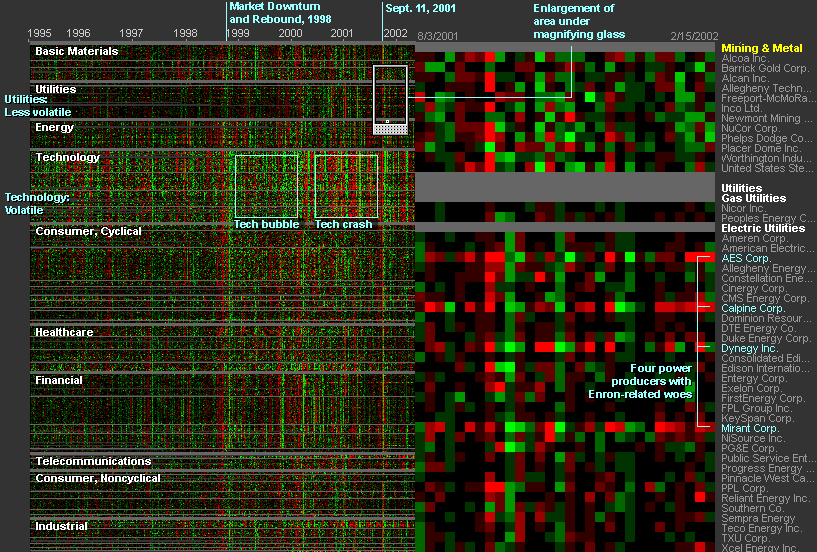
| 09:41, 27 March 2006 | Smartmoney06marketradar.gif (file) |  |
109 KB | Interactive data visualization of historical stock prices | 1 |
| 15:49, 10 April 2012 | Flowingdata2012visualizethis.png (file) |  |
111 KB | [FlowingData, 2012] Nathan Yau, FlowingData, Retrieved at: April 10, 2012. http://book.flowingdata.com/ | 1 |
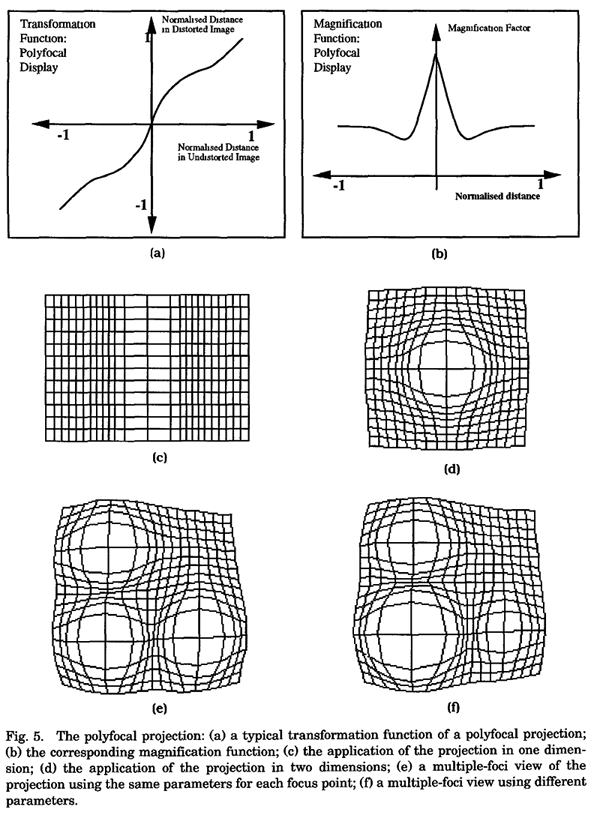
| 13:30, 13 October 2005 | Leung94polyfocal.gif (file) |  |
113 KB | Polyfocal display [Leung and Apperley, 1994] | 1 |
| 09:46, 25 October 2005 | Few04tracking-trends.gif (file) | 116 KB | Infographic "Tracking the Trends" | 1 | |
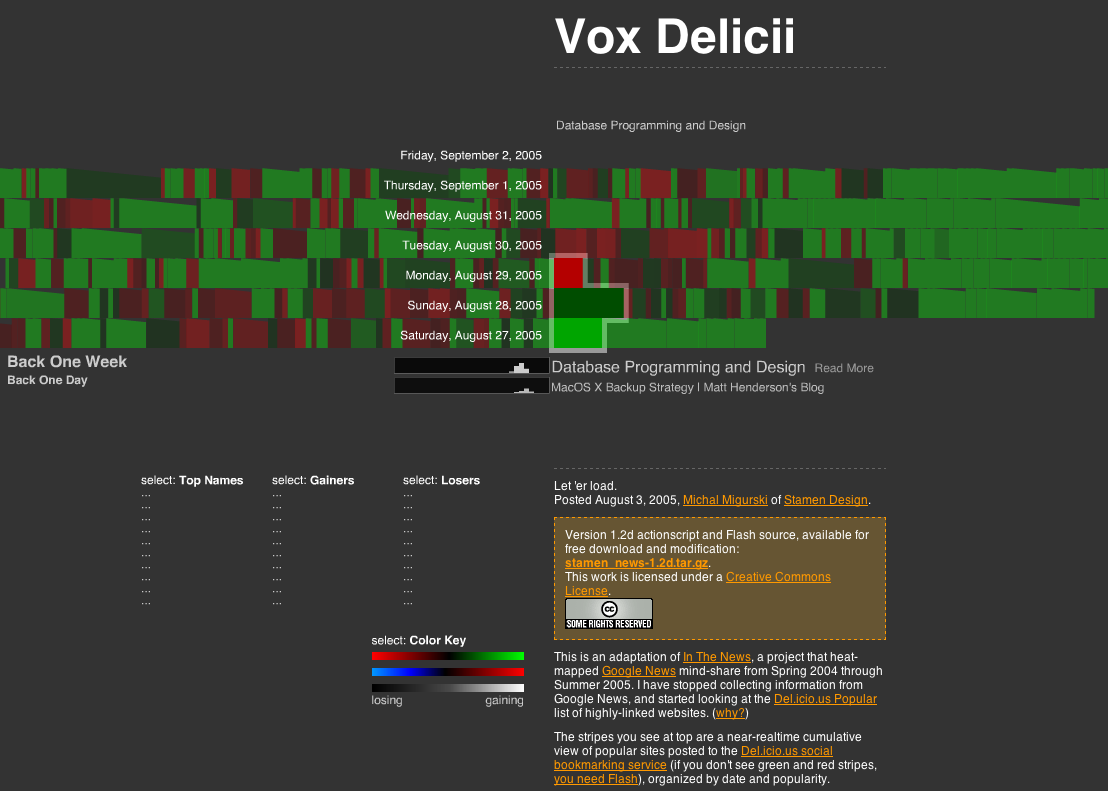
| 08:54, 2 September 2005 | Migurski05voxdelicii.png (file) |  |
116 KB | 1 | |
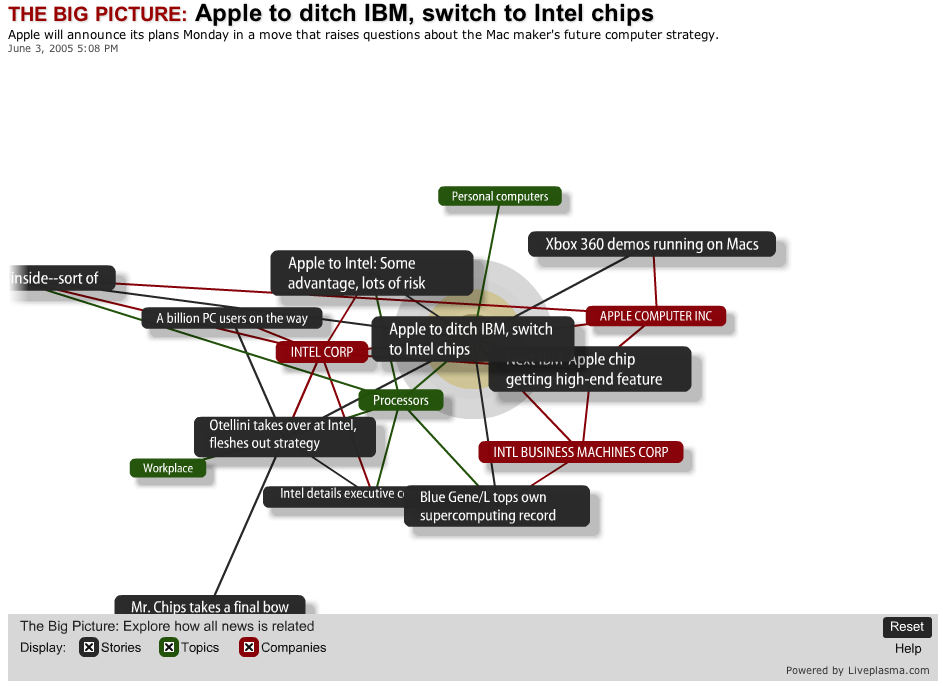
| 09:40, 4 October 2005 | Cnet05thebigpicture.png (file) |  |
117 KB | '''The Big Picture'' - Ontology viewer that connects stories, companies, and topics within the News.com website. | 1 |
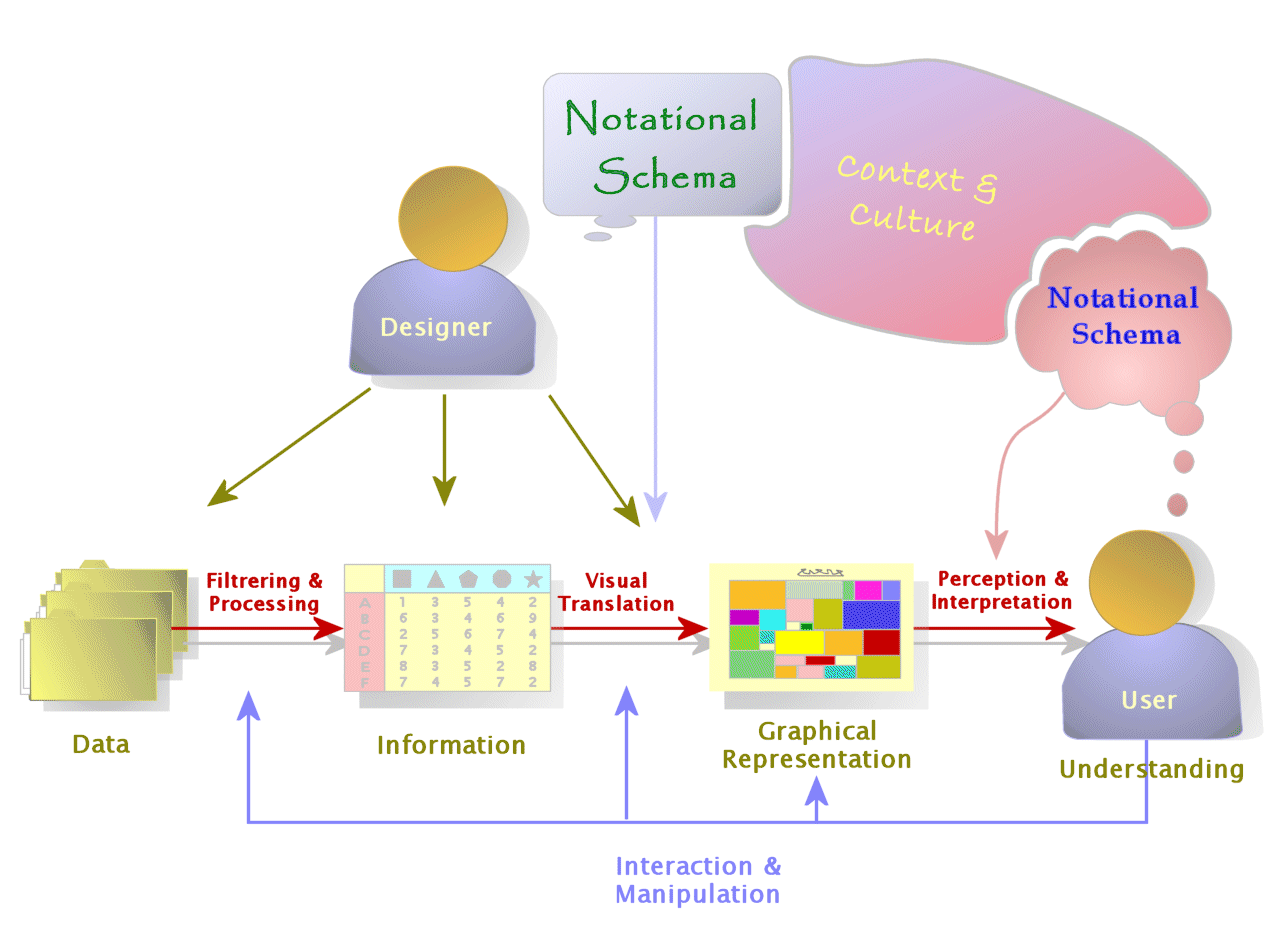
| 15:55, 15 February 2007 | Engelhardt07infovis-diagram.gif (file) |  |
132 KB | The Infovis diagram. | 1 |
| 15:01, 12 June 2012 | Oreilly 2012 datajournalismhandbook.png (file) |  |
139 KB | Book cover of Gray, J. and Chambers, L. and Bounegru, L., The Data Journalism Handbook, O'Reilly Media, 2012 | 1 |
| 13:55, 29 August 2005 | Wattenberg05colorcode.png (file) |  |
150 KB | 1 | |
| 20:27, 2 March 2012 | Beautiful-visualization.jpg (file) |  |
164 KB | Book Cover "Beautiful Visualization" | 1 |
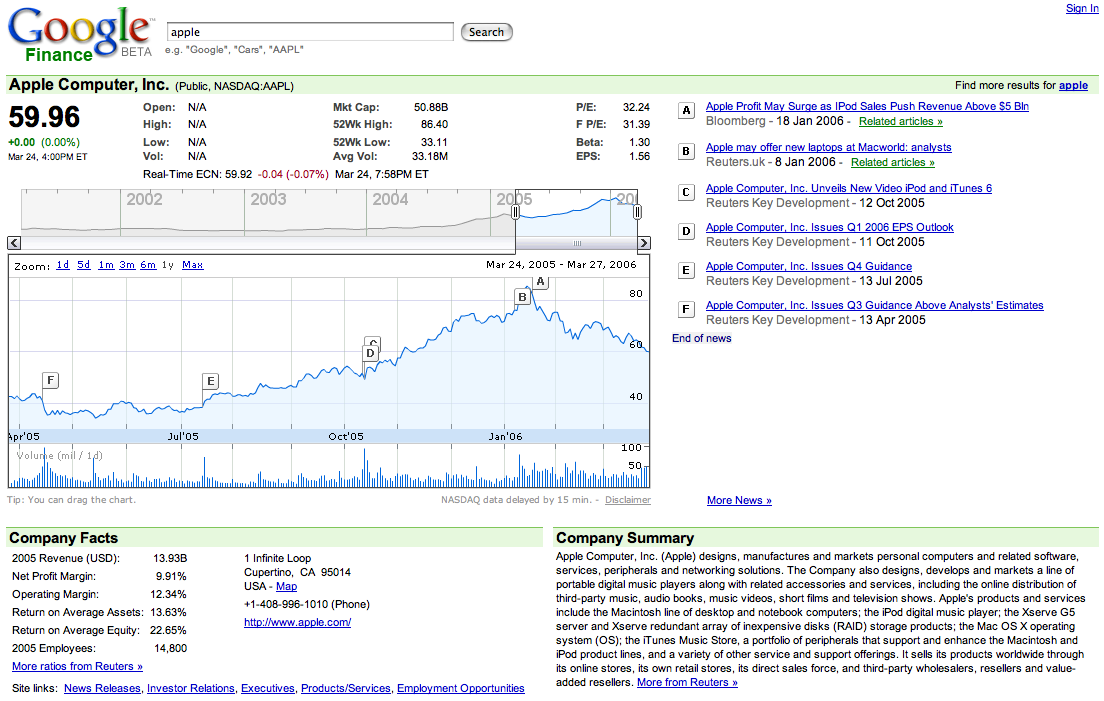
| 10:53, 27 March 2006 | Google06finance.png (file) |  |
170 KB | Interactive Flash graphs to explore stock price data from Google Finance. | 1 |
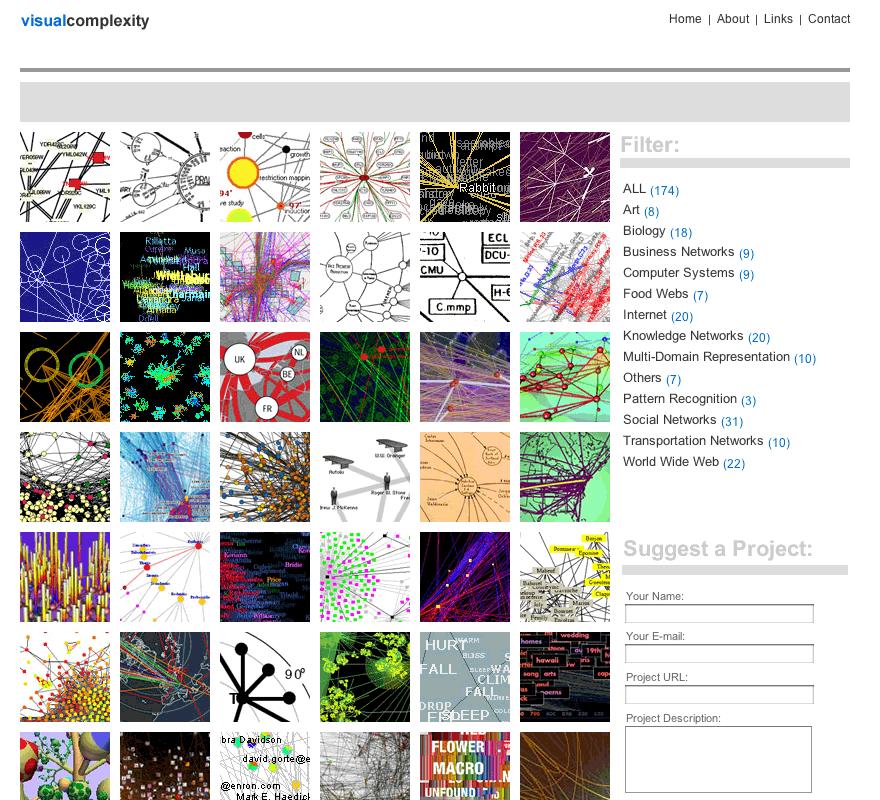
| 11:58, 17 October 2005 | Lima05visualcomplexity.png (file) |  |
181 KB | Screenshot of '''VisualComplexity.com''', a repository of complext network visualizations | 1 |
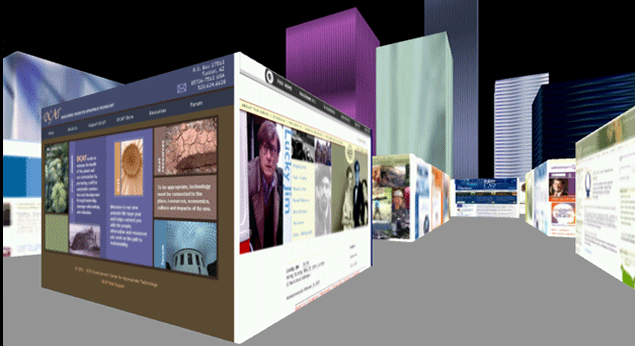
| 10:58, 10 October 2005 | ThreeB043B browser.png (file) |  |
183 KB | 3B browser | 1 |
| 10:33, 26 August 2008 | Ogawa08codeswarm.png (file) |  |
218 KB | code_swarm - Organic software visualization | 1 |
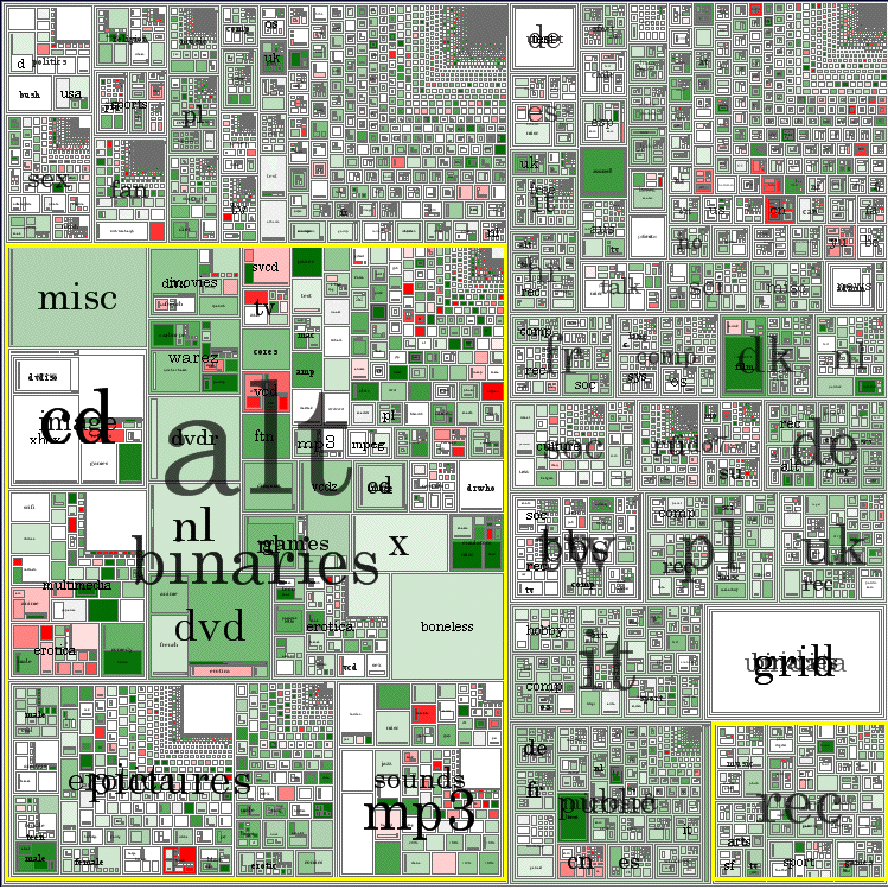
| 10:11, 26 August 2005 | Turner05usenet.gif (file) |  |
277 KB | 1 | |
| 16:37, 27 August 2009 | Infovis-wiki tagcloud 20090827.png (file) |  |
291 KB | Wordle generated Tag Cloud of InfoVis Wiki content | 2 |
| 09:59, 29 July 2008 | Elsevier08ware-visual-thinking.jpg (file) |  |
323 KB | Book Cover "Visual Thinking for Design - Colin Ware" | 1 |
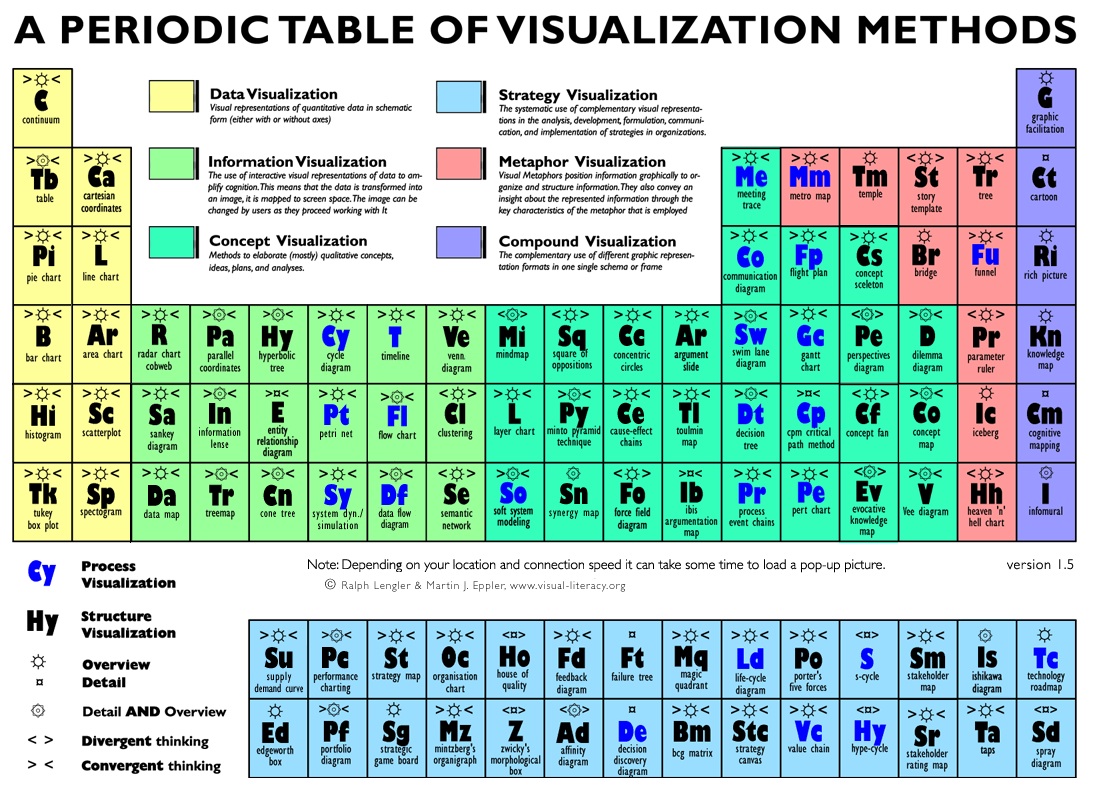
| 14:27, 1 March 2007 | Lengler07periodic-table.jpg (file) |  |
375 KB | A Periodic Table of Visualization Methods ([http://www.visual-literacy.org/periodic_table/periodic_table.html# interactive version]) | 1 |
| 18:05, 4 December 2006 | Prefuse-tutorial-20061127-handout.pdf (file) | 658 KB | prefuse Tutorial by Wolfgang Aigner | 1 | |
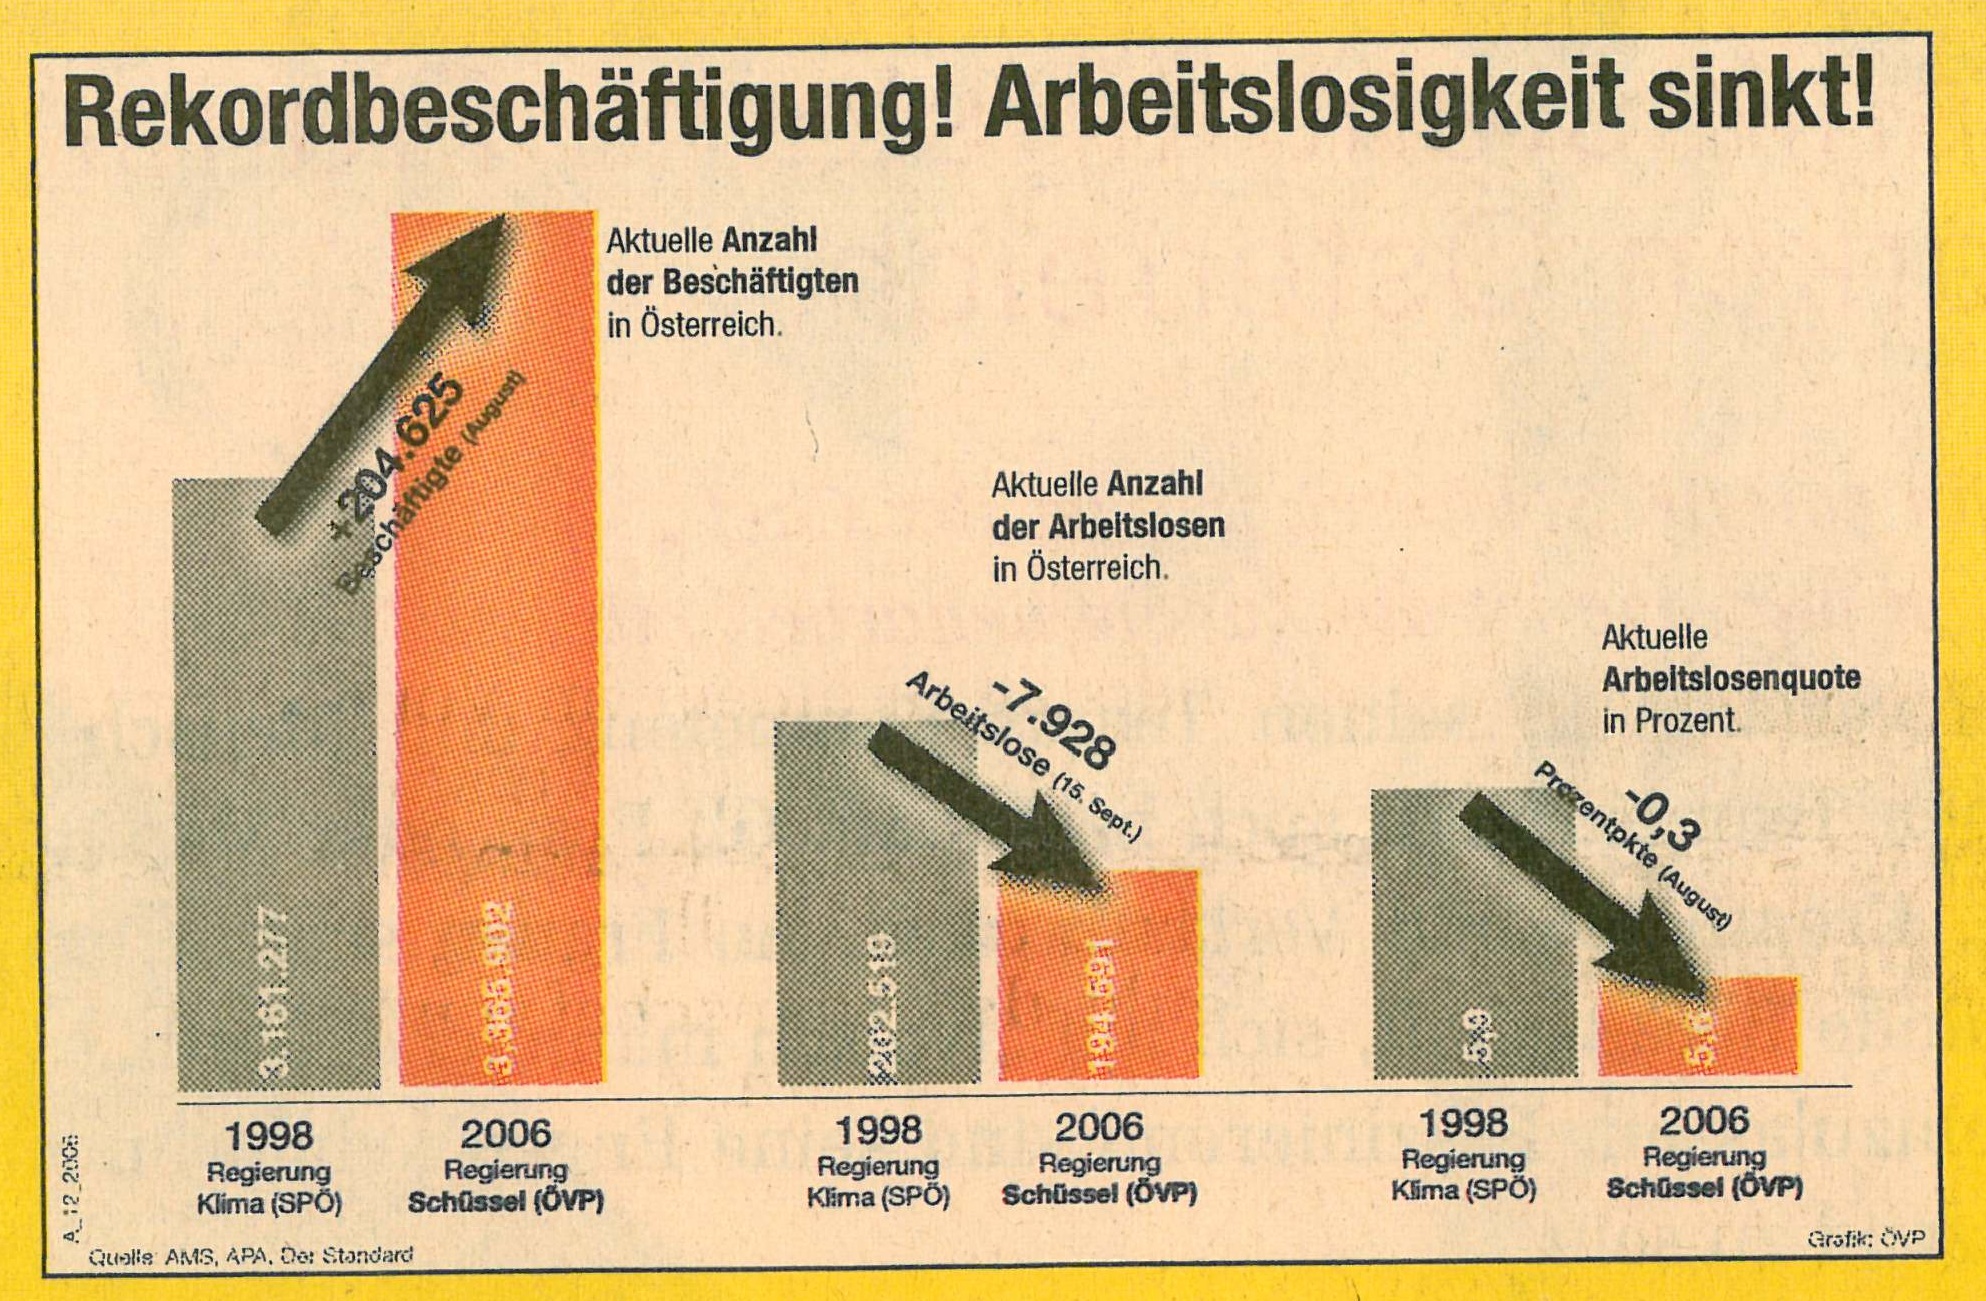
| 10:53, 24 October 2006 | Derstandard06rekordbeschaeftigung.jpg (file) |  |
821 KB | Rekordbeschäftigung! Arbeitslosigkeit sinkt! | 1 |
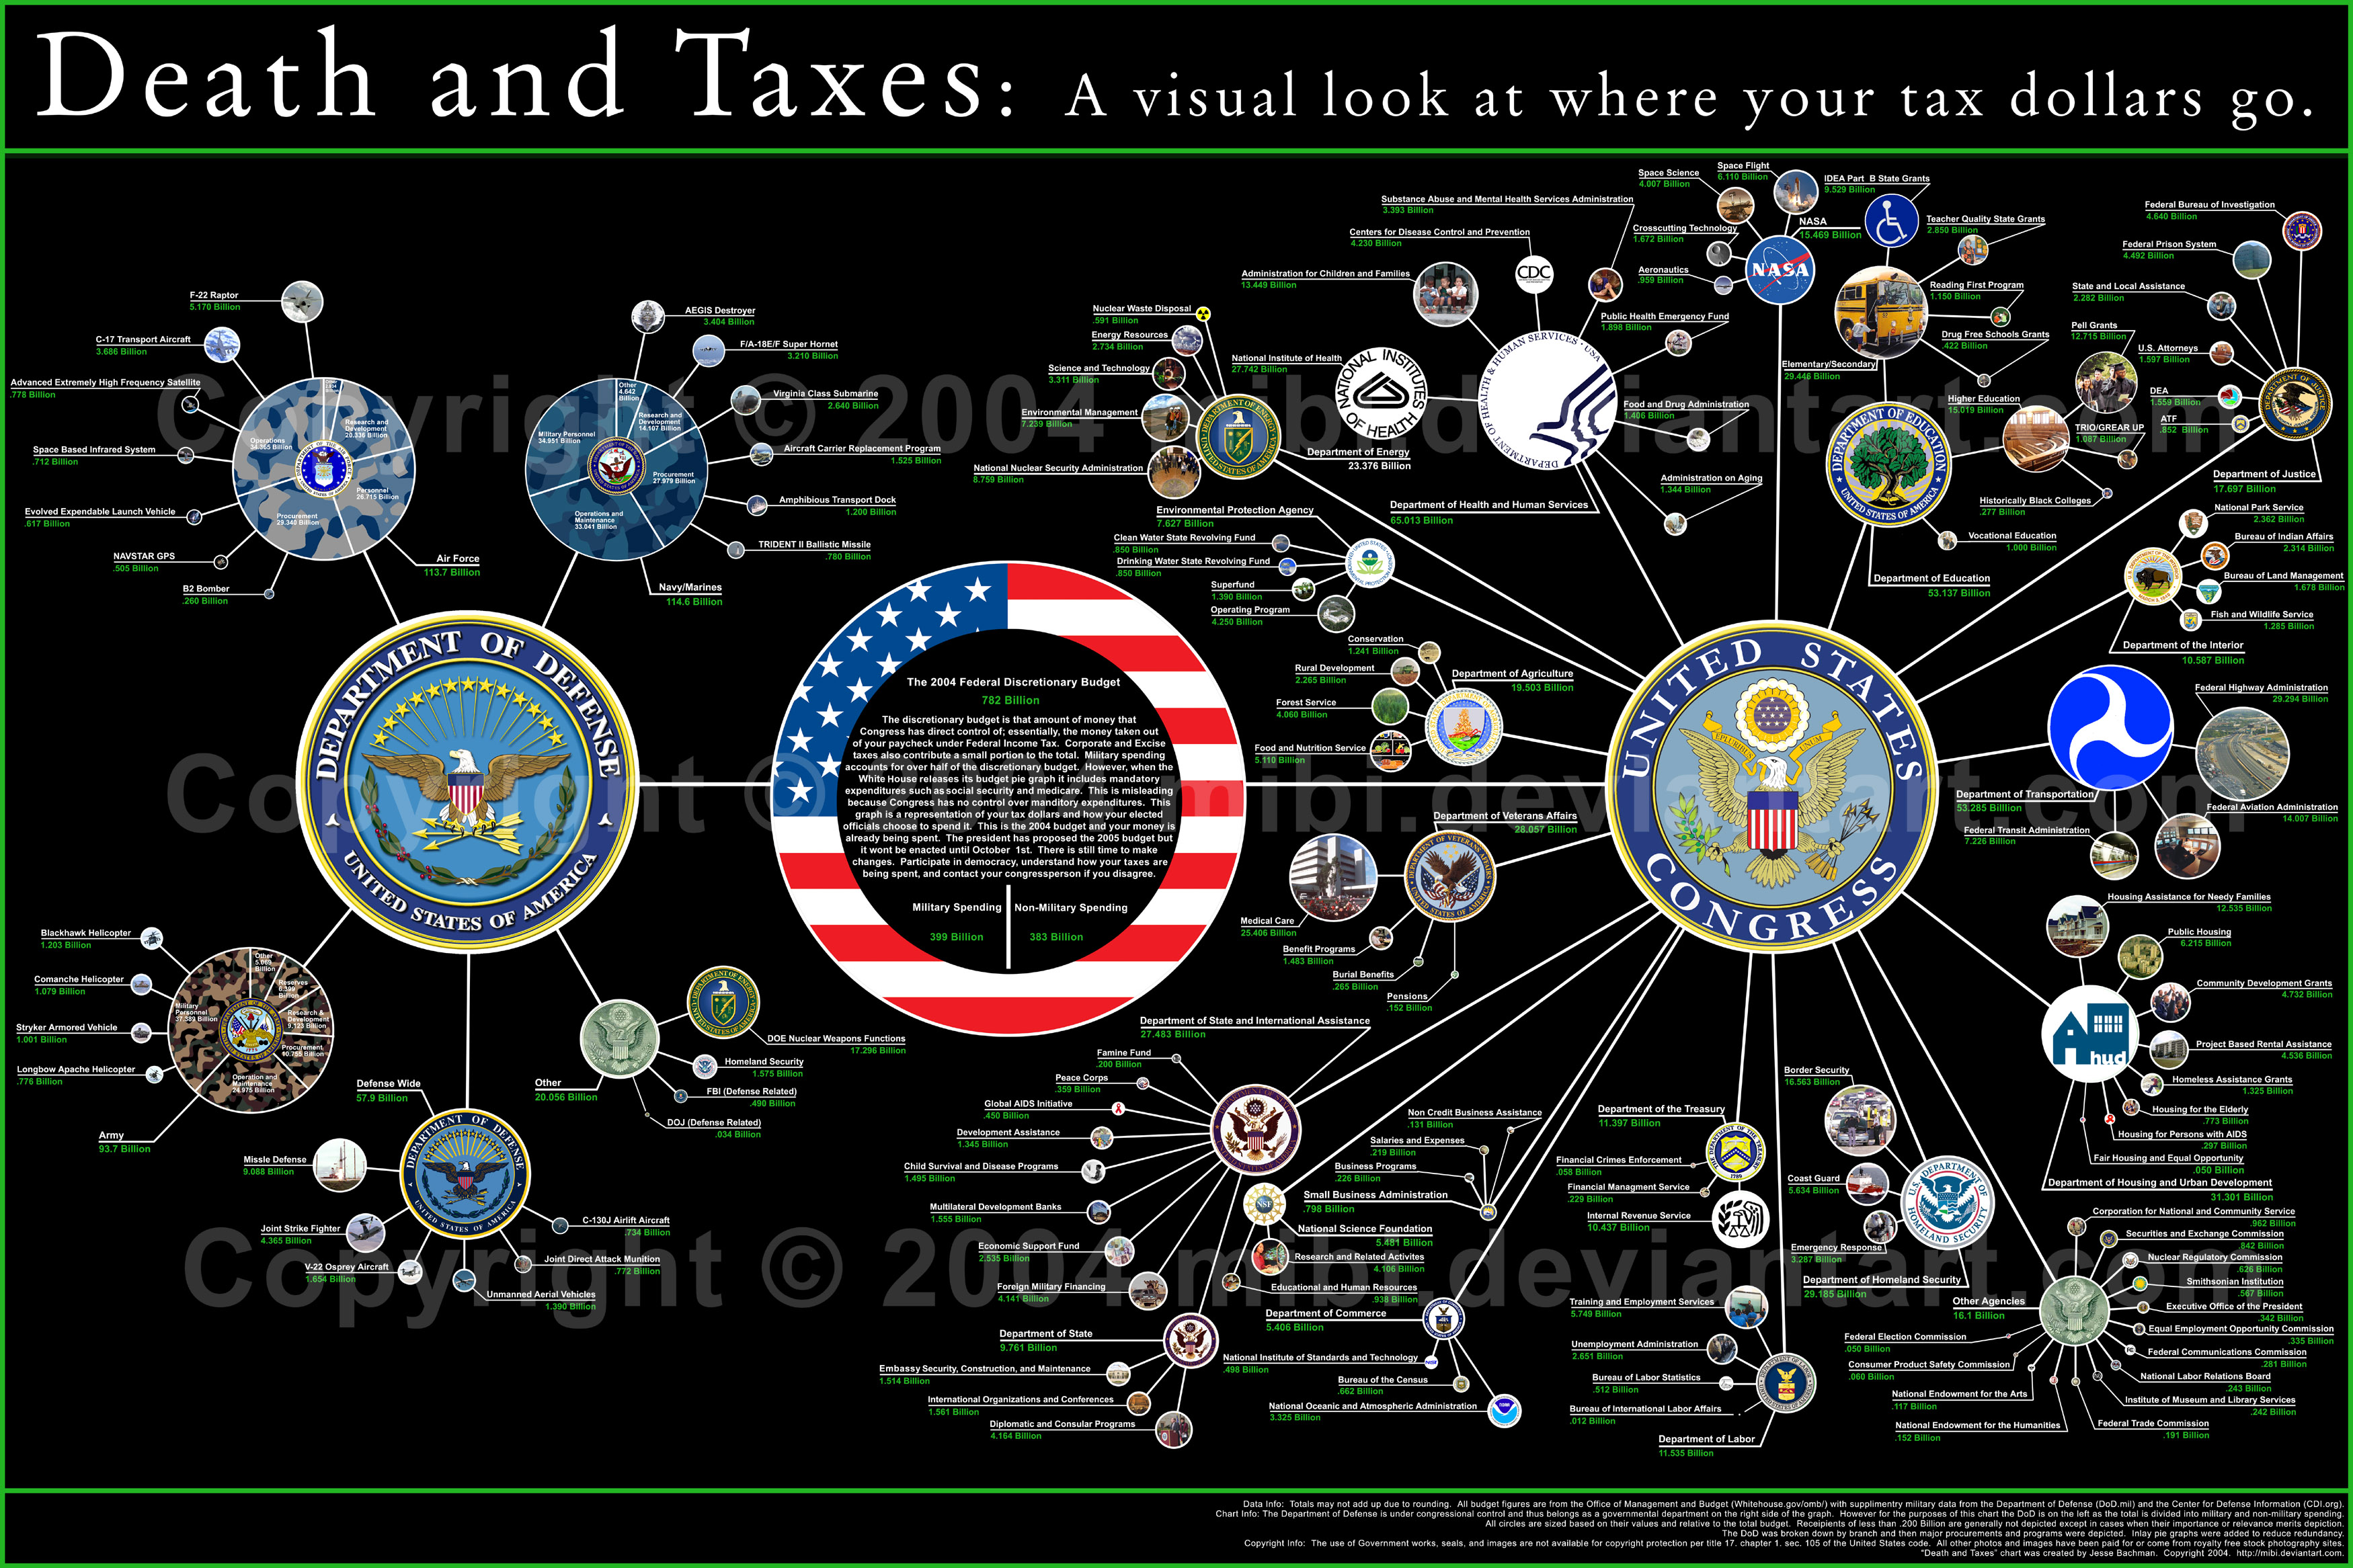
| 09:42, 25 October 2005 | Mibi04death-and-taxes.jpg (file) |  |
1.76 MB | Death and Taxes: A visual look at where your tax dollars go. {{Quotation|Most people are unaware of how much of their taxes fund our military, and those aware are often misinformed. Well here it is. Laid out, easy to read and compare. With data straight | 1 |
| 17:32, 4 December 2006 | Aigner 2006 wikiposium infovis-wiki.pdf (file) | 1.93 MB | Slides of InfoVis:Wiki presentation at Wikiposium 2006 | 1 |