File list
Jump to navigation
Jump to search
This special page shows all uploaded files.
| Date | Name | Thumbnail | Size | User | Description | Versions |
|---|---|---|---|---|---|---|
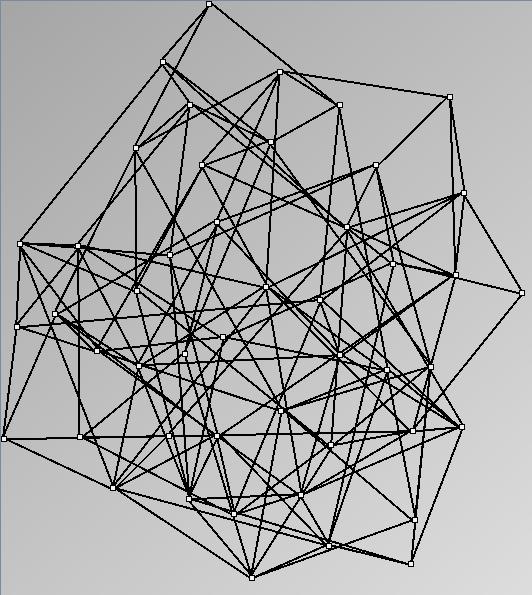
| 16:51, 6 October 2006 | WSmallWorld 47 0.7 6.JPG (file) |  |
75 KB | Socnet | 1 | |
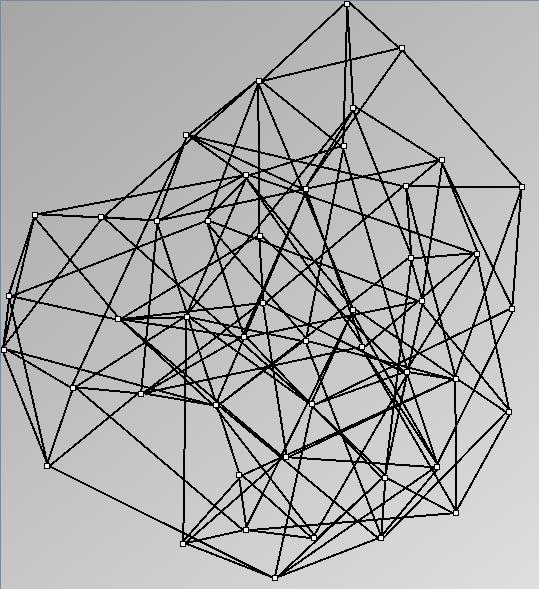
| 16:51, 6 October 2006 | WSmallWorld 47 0.9 6.JPG (file) |  |
74 KB | Socnet | 1 | |
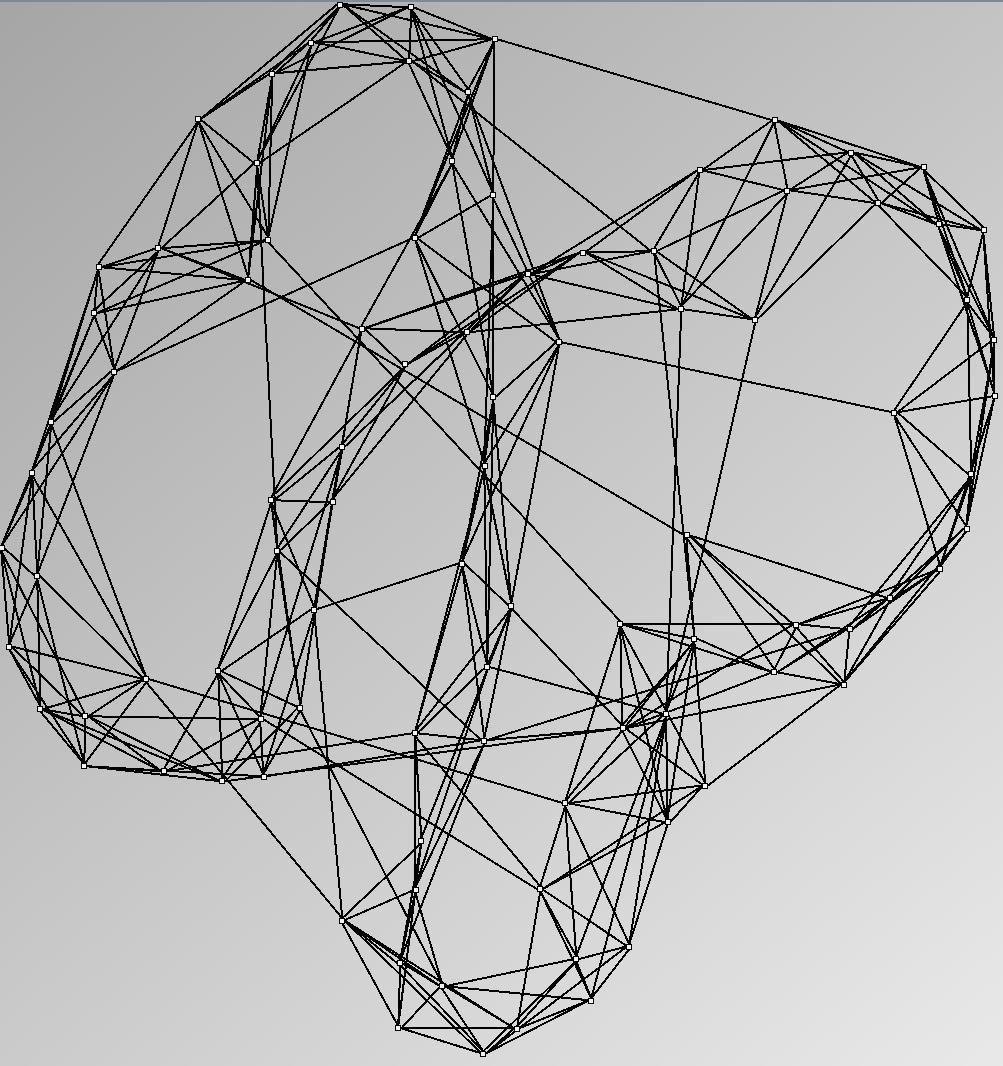
| 16:30, 9 October 2006 | WSmallWorld 94 0.1 8.JPG (file) |  |
181 KB | Socnet | 1 | |
| 12:49, 14 April 2007 | Wanghongan.jpg (file) |  |
19 KB | UE-InfoVis07-01 | Image retrieved on April 14th, 2007 | 1 |
| 13:00, 14 April 2007 | Wanghongan s.jpg (file) |  |
39 KB | UE-InfoVis07-01 | Retrieved on April 14th, 2007 | 1 |
| 23:31, 10 April 2006 | Ward.jpg (file) |  |
5 KB | UE-InfoVis06-11 | This is Matthew O. Ward! | 1 |
| 23:29, 10 April 2006 | Ware.jpg (file) |  |
15 KB | UE-InfoVis06-11 | This is Colin Ware. | 1 |
| 14:25, 1 July 2005 | Ware infovis.jpg (file) |  |
64 KB | Klaus | Book cover of Information Visualization - Perception for Design Second Edition by Colin Ware. | 1 |
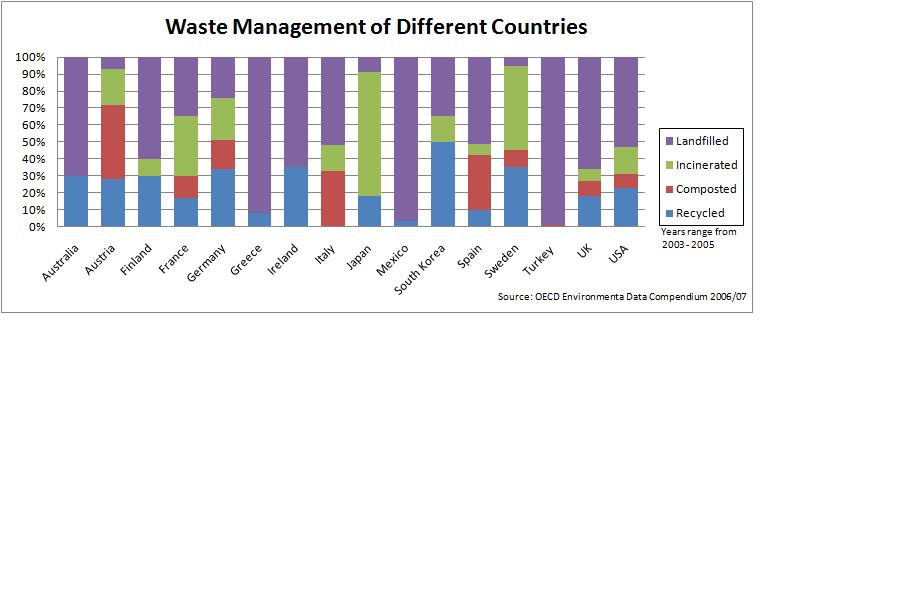
| 14:54, 4 January 2010 | WasteManagement1.jpg (file) |  |
49 KB | UE-InfoVis0910 0261242 | 1 | |
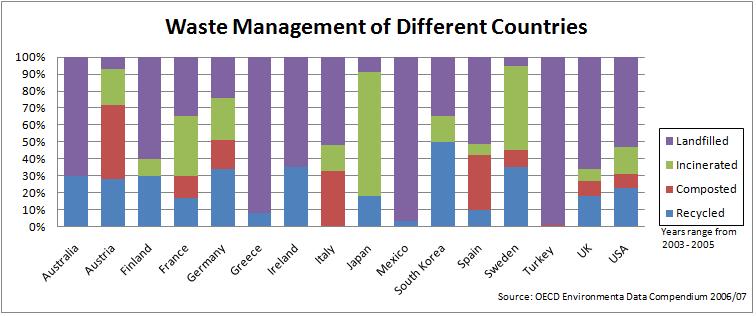
| 14:59, 4 January 2010 | WasteManagement2.jpg (file) |  |
44 KB | UE-InfoVis0910 0261242 | 1 | |
| 10:18, 26 May 2009 | Wat pivotgraph overview.jpg (file) |  |
46 KB | UE-InfoVis09-04 | Example rolled-up multivariate graph done by PivotGraph (Wattenberg, 2006) | 1 |
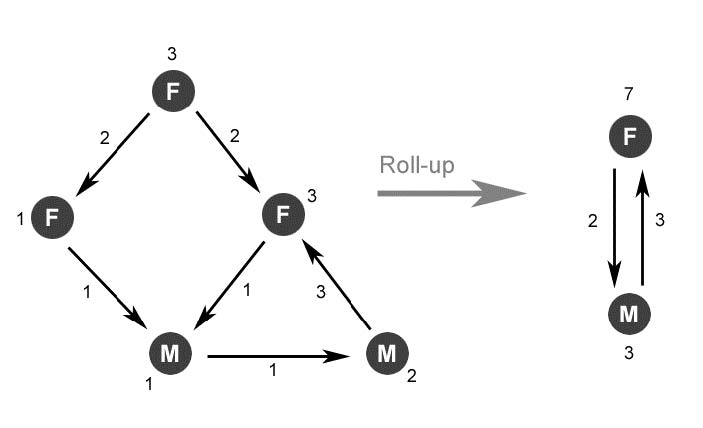
| 10:22, 26 May 2009 | Wat pivotgraph roll-up.jpg (file) |  |
15 KB | UE-InfoVis09-04 | Displaying the roll-up process in a multivariate graph. | 1 |
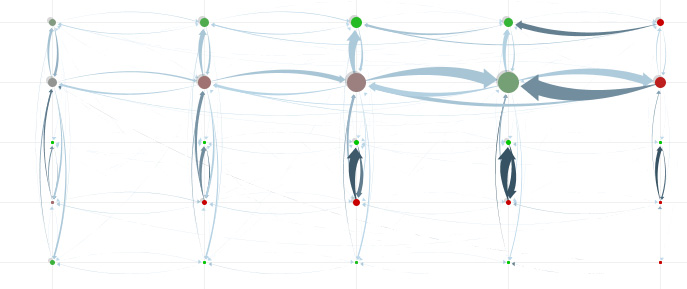
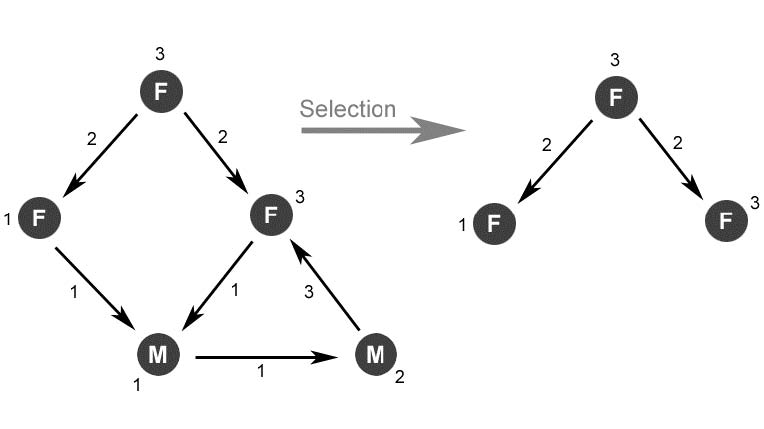
| 10:23, 26 May 2009 | Wat pivotgraph select.jpg (file) |  |
17 KB | UE-InfoVis09-04 | Displaying a selection in a (multivariate) network graph | 1 |
| 10:26, 26 May 2009 | Wat pivotgraph singledim.jpg (file) |  |
34 KB | UE-InfoVis09-04 | on 1 dimension rolled-up multivariate graph done by PivotGraph | 1 |
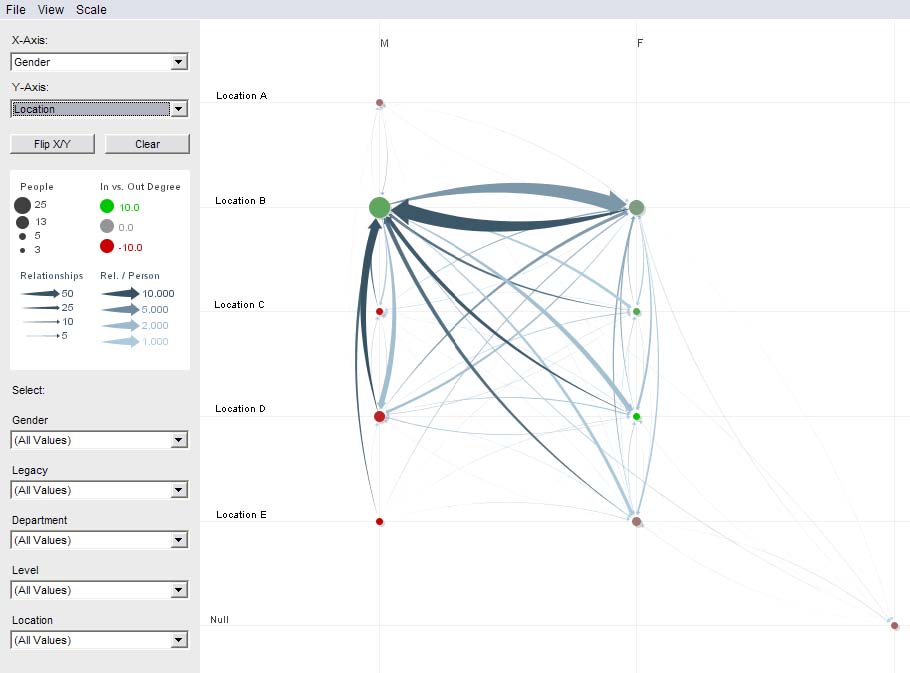
| 10:26, 26 May 2009 | Wat pivotgraph ui.jpg (file) |  |
52 KB | UE-InfoVis09-04 | User interface of PivotGraph | 1 |
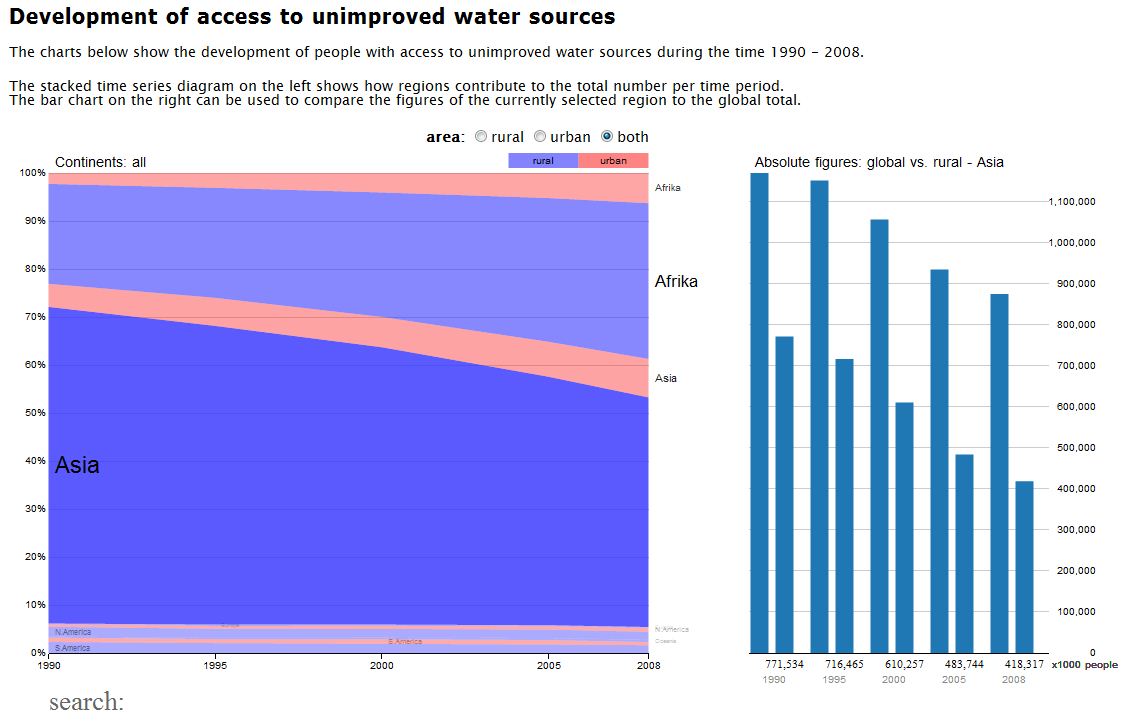
| 20:19, 17 January 2011 | Watervis-stackedtimeseries.jpg (file) |  |
101 KB | InfoVis1011 9925916 | The visualisation shows the development of access to unimproved water sources, based on data from the Joint Monitoring Program for Water Supply and Sanitation (JMP) of the World Health Organization (WHO) and the UN Children’s Fund (UNICEF). http://www.w | 2 |
| 18:37, 17 January 2011 | Watervisbarchart.png (file) |  |
36 KB | UE-InfoVis1011 0326062 | The bar chart shows the improvement/decline of drinking water supply | 1 |
| 22:53, 10 April 2006 | Wattenberg.jpg (file) |  |
6 KB | UE-InfoVis06-11 | This is Martin Wattenberg! | 1 |
| 13:55, 29 August 2005 | Wattenberg05colorcode.png (file) |  |
150 KB | Iwolf | 1 | |
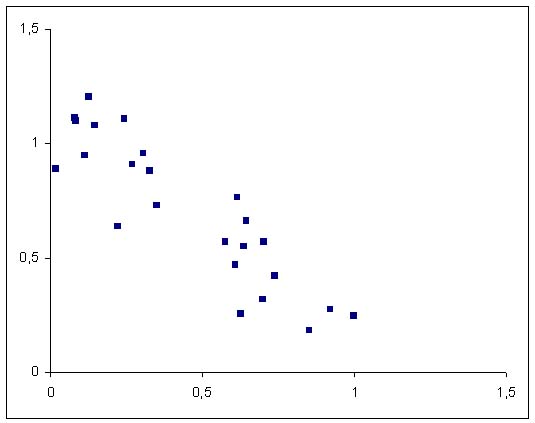
| 13:16, 2 November 2008 | WeakNegativeCorrelation.jpg (file) |  |
24 KB | UE-InfoVis0809 9607701 | Scatterplot of two variables with weak negative correlation. | 1 |
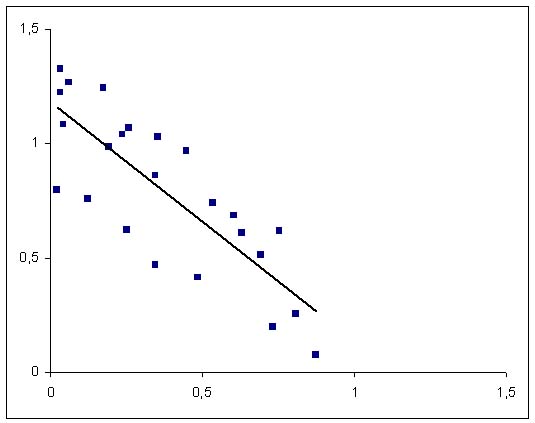
| 13:17, 2 November 2008 | WeakNegativeCorrelationLine.jpg (file) |  |
28 KB | UE-InfoVis0809 9607701 | Scatterplot of two variables with weak negative correlation, featuring regression line. | 1 |
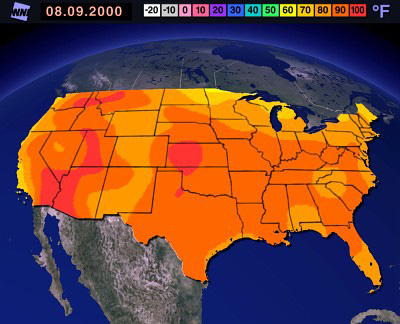
| 02:14, 9 November 2007 | Weather.jpg (file) |  |
67 KB | UE-InfoVis0708 0525566 | Isarithmic example | 1 |
| 11:43, 30 October 2008 | Weather map.jpg (file) |  |
133 KB | UE-InfoVis0809 0426276 | The map shows the analysis of the weather condition. | 1 |
| 21:57, 6 November 2009 | Web-statistics.jpg (file) |  |
53 KB | Katharina-Anna Wendelin | 1.web-statistics: author: Web Design Perth - www.gtp-icommerce.com, organization: GTP iCommerce, title: Web Site Statistics Information For Your Australian Web Site Package, retrieved at: 03 Nov 2009: | 1 |
| 21:58, 1 December 2009 | Web-statistics new.jpg (file) | 102 KB | UE-InfoVis0910 0502377 | 10 | ||
| 19:21, 5 November 2008 | Web statistics.jpg (file) |  |
53 KB | Martha Kaltenecker | 1 | |
| 14:14, 1 May 2008 | Weimaoke.jpg (file) |  |
10 KB | UE-InfoVis08-02 | photo of weimao ke from http://lair.ils.unc.edu/~wke/wiki/doku.php | 1 |
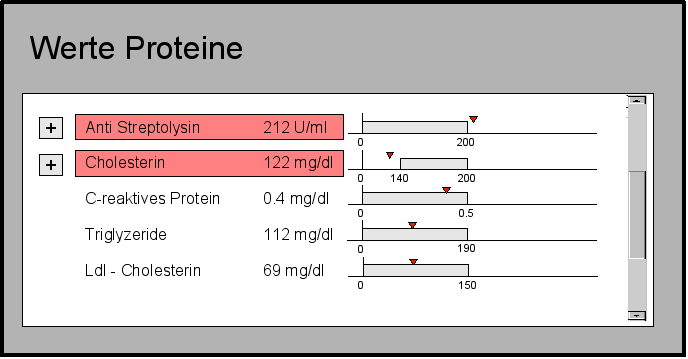
| 23:53, 3 January 2008 | Werte-Protein.png (file) |  |
18 KB | UE-InfoVis0708 8740247 | Werteliste Proteine Abgabe4 | 1 |
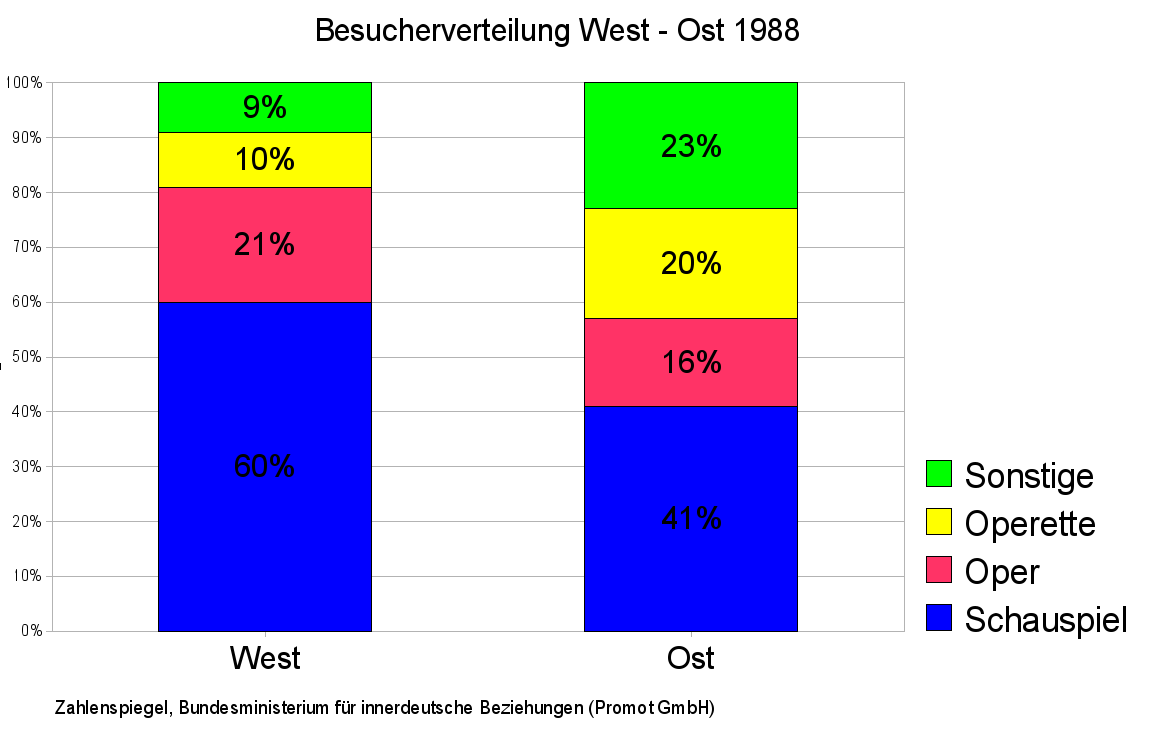
| 18:44, 3 December 2007 | West ost.png (file) |  |
53 KB | UE-InfoVis0708 8007433 | Graph for Infovis0708, example 3, group 5 | 1 |
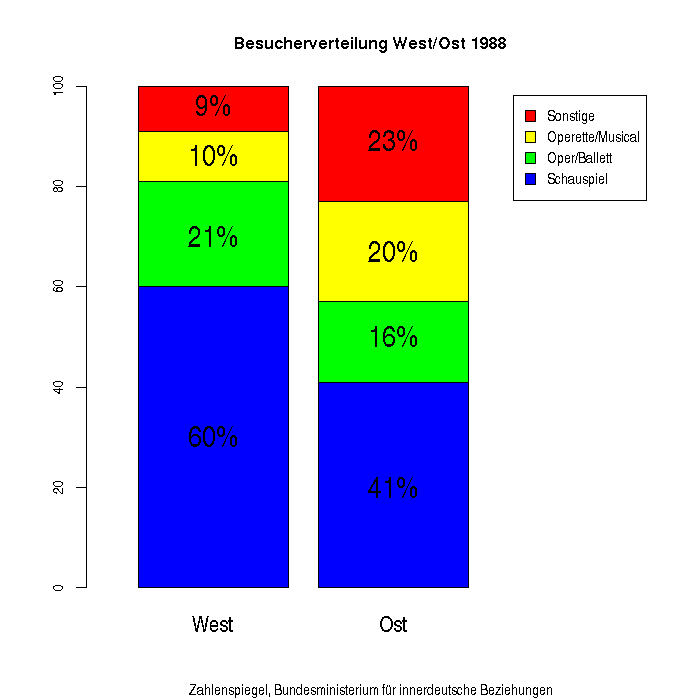
| 21:20, 3 December 2007 | West ost02.png (file) |  |
7 KB | UE-InfoVis0708 8007433 | 1 | |
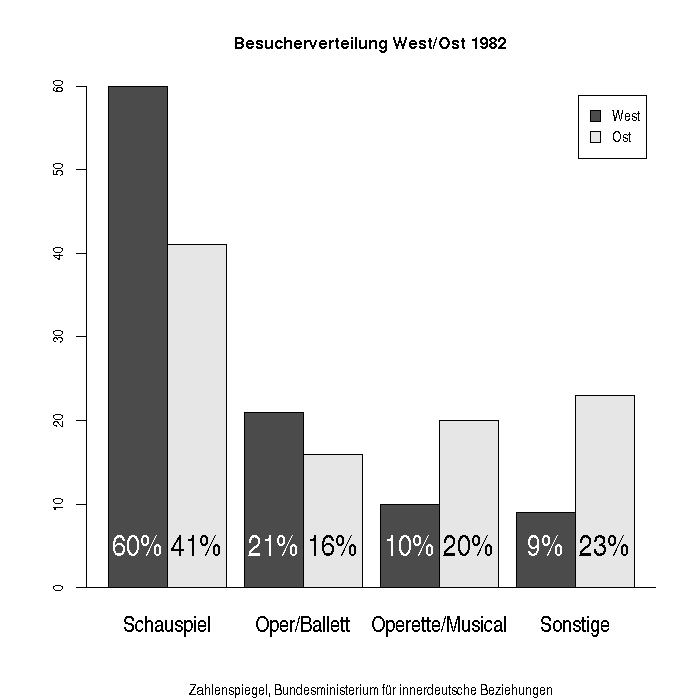
| 20:54, 8 December 2007 | West ost03.png (file) |  |
8 KB | UE-InfoVis0708 8007433 | 1 | |
| 19:01, 13 January 2008 | West ost04.png (file) |  |
7 KB | UE-InfoVis0708 8007433 | 1 | |
| 23:03, 8 November 2007 | Whirlwind.jpg (file) |  |
11 KB | UE-InfoVis0708 0225966 | Image of whirlwind display | 1 |
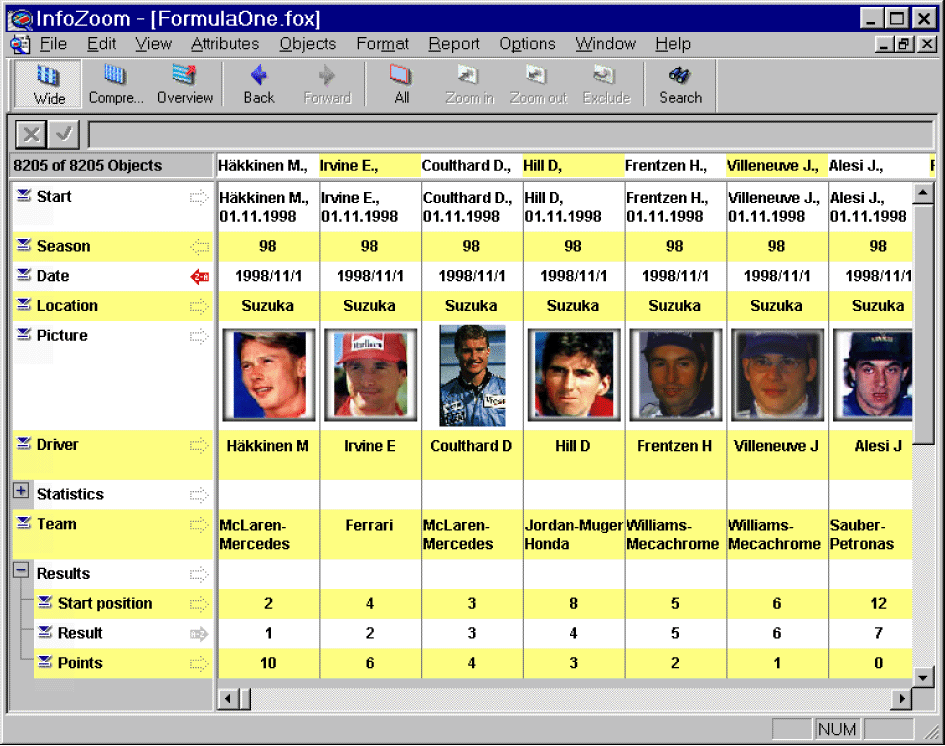
| 22:40, 30 October 2006 | Wide table.gif (file) |  |
126 KB | UE-InfoVis0607 0226388 | InfoZoom Wide Table mode | 1 |
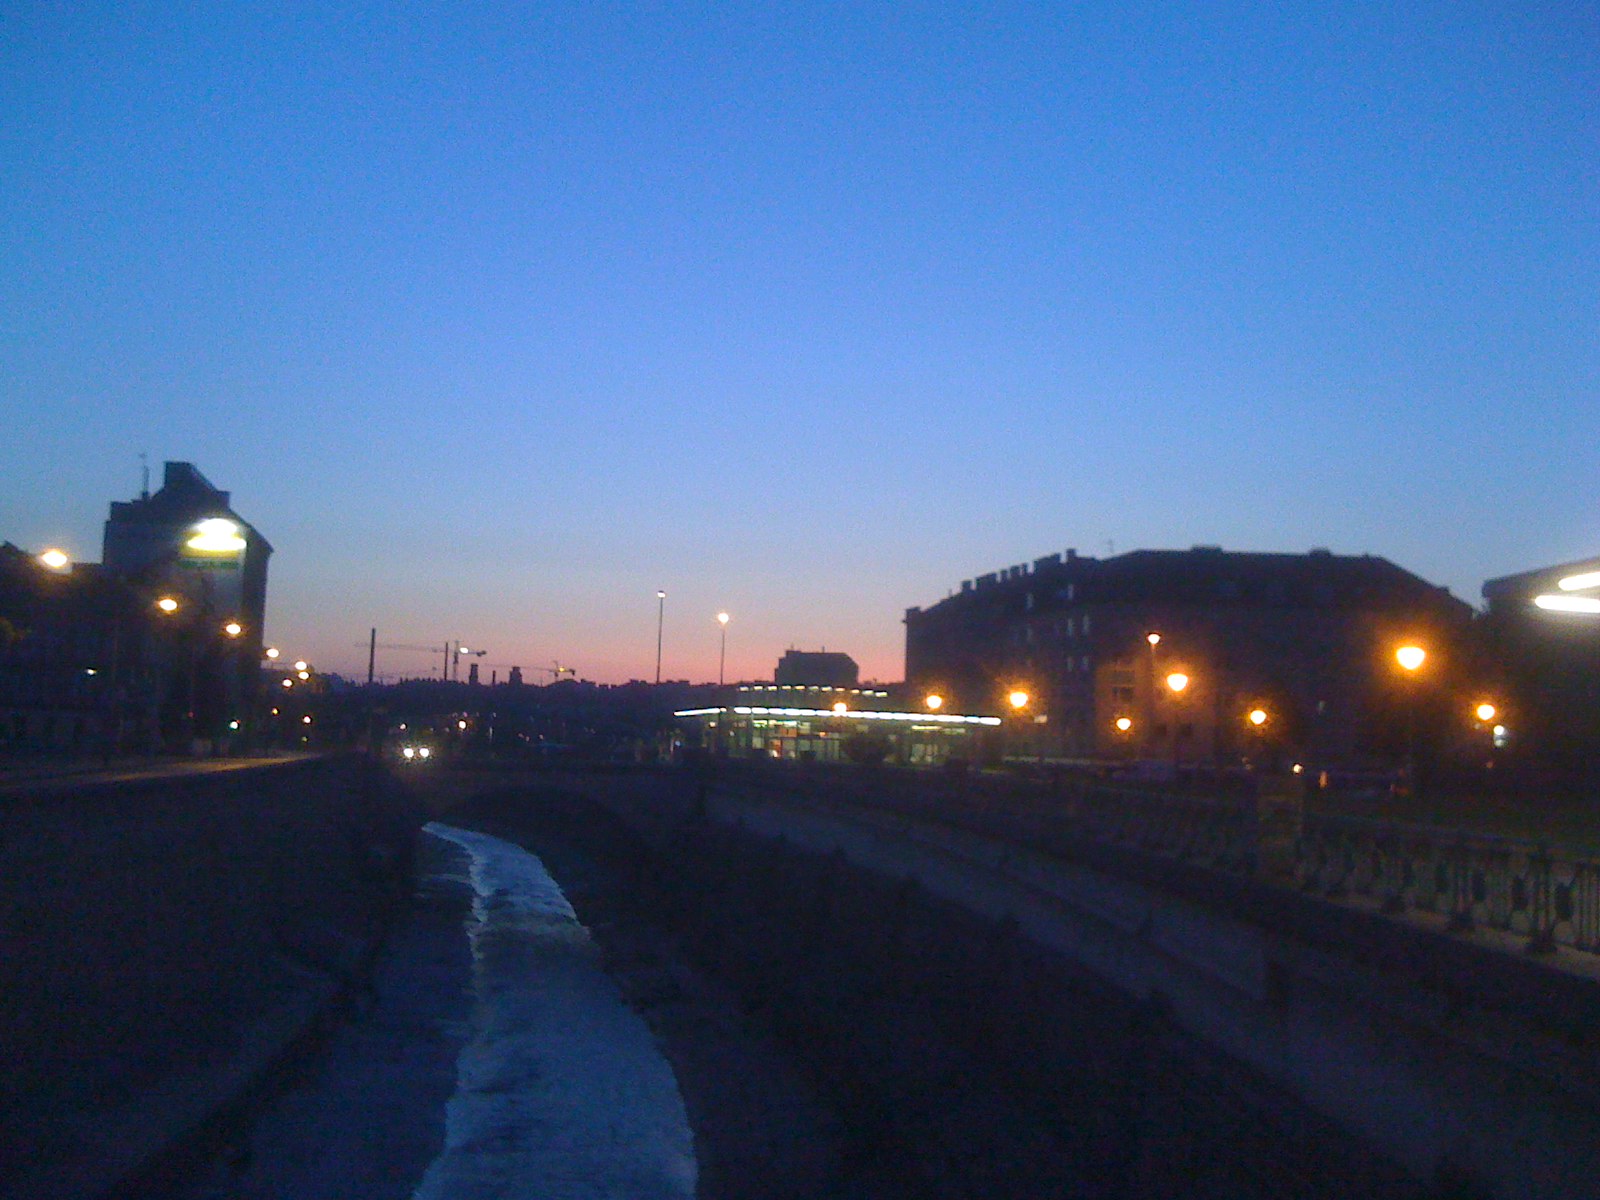
| 15:15, 25 October 2009 | Wien.JPG (file) |  |
309 KB | UE-InfoVis0910 0325870 | Längenfeldgasse bei Sonnenaufgang. | 1 |
| 00:52, 14 April 2006 | Williamson.jpg (file) |  |
4 KB | UE-InfoVis06-13 | 1 | |
| 11:36, 12 November 2008 | Wilmarth08 new.jpg (file) |  |
45 KB | UE-InfoVis0809 0426276 | 1 | |
| 13:59, 19 November 2008 | Wilmarth08 new2.jpg (file) |  |
96 KB | UE-InfoVis0809 0827047 | 2 | |
| 13:13, 29 November 2008 | Wilmarth08 new3.png (file) |  |
6 KB | UE-InfoVis0809 0827047 | 1 | |
| 17:34, 12 October 2009 | Win.jpg (file) |  |
52 KB | UE-InfoVis0910 0526452 | Windows 7 inspired | 1 |
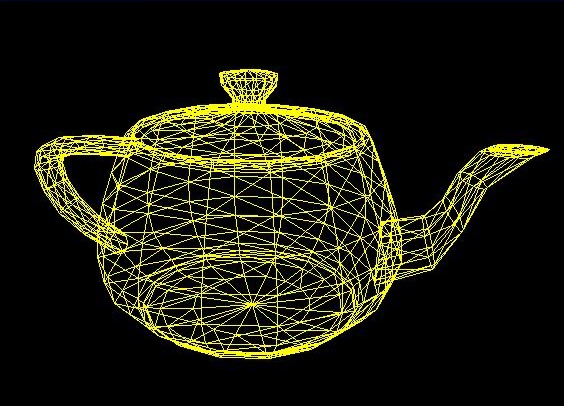
| 13:09, 3 November 2007 | Wire frame.jpg (file) |  |
130 KB | UE-InfoVis0708 0425163 | teapot surface in wire frame mode | 1 |
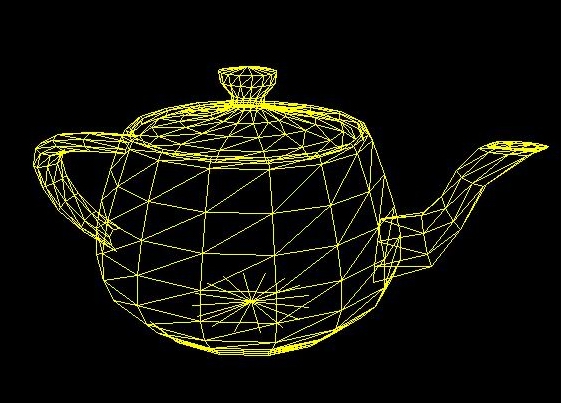
| 13:24, 3 November 2007 | Wire frame backface culling.jpg (file) |  |
114 KB | UE-InfoVis0708 0425163 | teapot in wire frame mode with visibility detection (backface culling) | 1 |
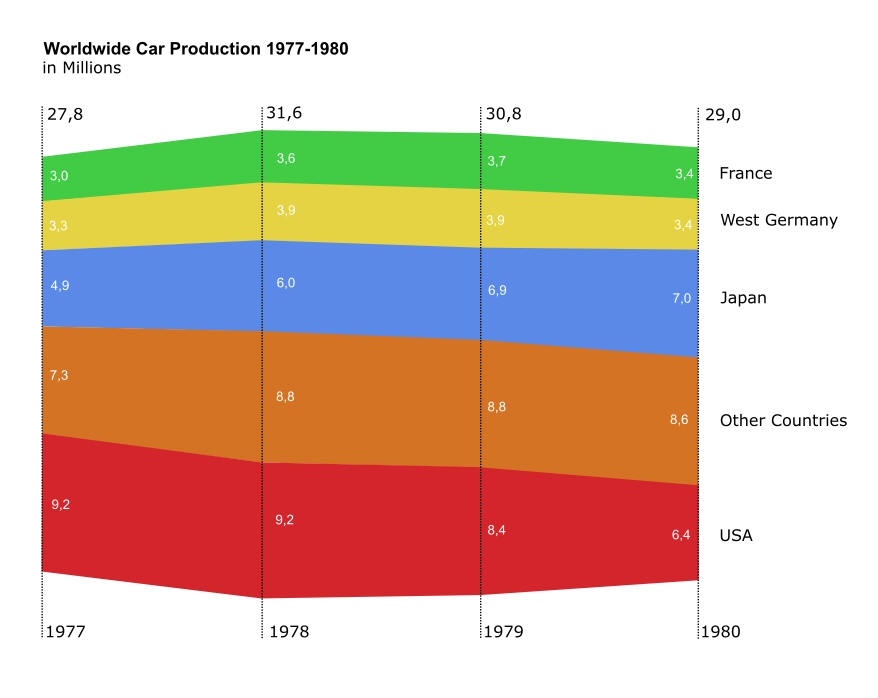
| 12:47, 9 November 2005 | World car production themeriver.jpg (file) |  |
96 KB | UE-InfoVis0506 9426777 | Diskussionsbeitrag Themeriver Worldwide car production 1977-1980 | 2 |
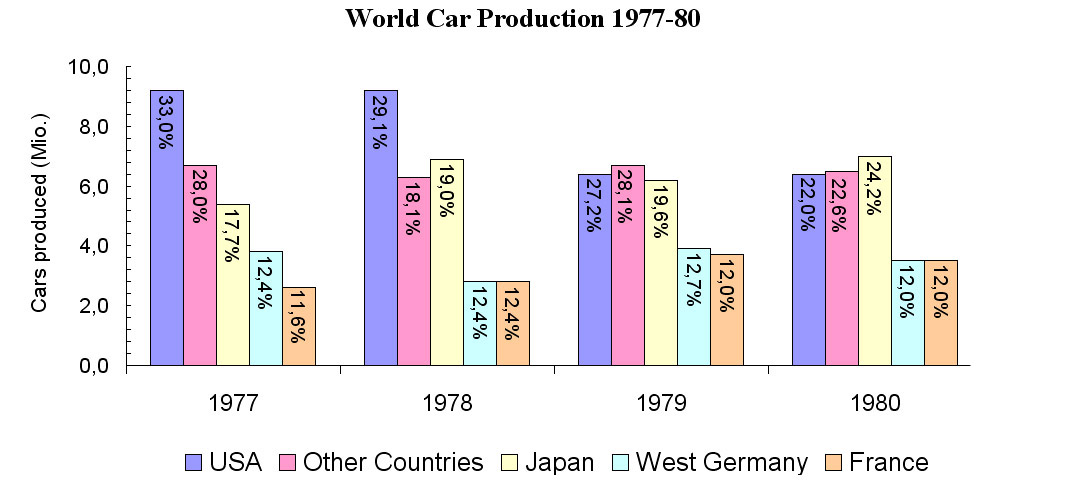
| 12:47, 3 November 2005 | Worldcarprod.jpg (file) |  |
105 KB | UE-InfoVis0506 0125718 | World Car Production 1977-80 | 5 |
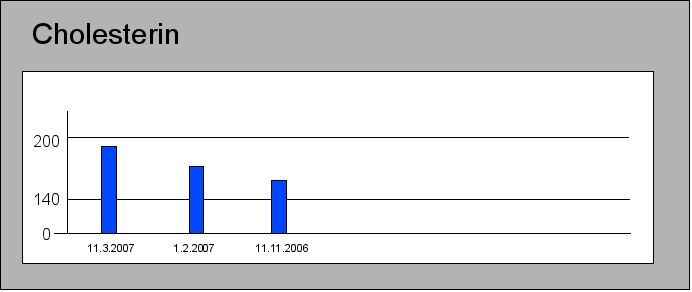
| 23:54, 3 January 2008 | Zeitreihe.png (file) |  |
6 KB | UE-InfoVis0708 8740247 | Cholesterin Zeitreihe | 1 |
| 15:06, 15 September 2005 | Zitvogel05delicioussoup.png (file) |  |
35 KB | Iwolf | Delicious Soup - A tool that reveals your del.icio.us activities... | 1 |
| 20:55, 19 June 2005 | Zook large.gif (file) |  |
98 KB | WikiSysop | 1 | |
| 02:16, 9 November 2007 | Zoom2 lowres.jpg (file) |  |
51 KB | UE-InfoVis0708 0525566 | Dasymetric example | 1 |
| 06:32, 24 October 2005 | Zweite.gif (file) |  |
21 KB | Gulsum | 2 | |
| 06:50, 24 October 2005 | Zweite1.png (file) |  |
22 KB | Gulsum | 1 |