Uploads by UE-InfoVis0607 0727197
Jump to navigation
Jump to search
This special page shows all uploaded files.
| Date | Name | Thumbnail | Size | Description | Versions |
|---|---|---|---|---|---|
| 16:04, 23 November 2007 | Table1.JPG (file) | 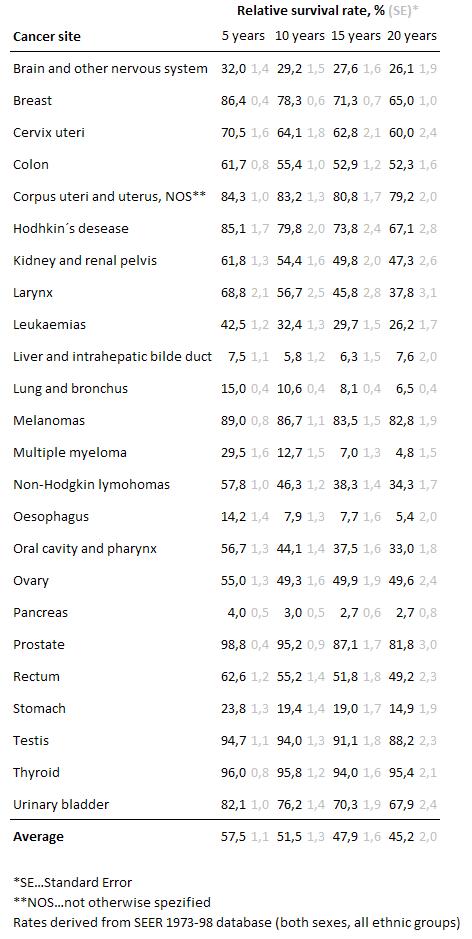 |
71 KB | Version 1 of cancer table | 4 |
| 15:43, 9 November 2007 | Clipboard04.jpg (file) | 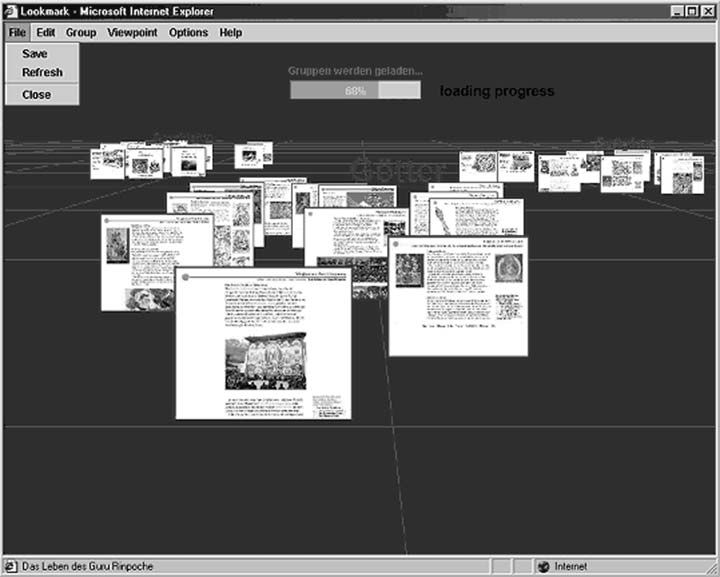 |
46 KB | Lookmark user interface screenshot. The user interface consists of a 2D control panel that contains a menu and a media loading progress bar and a 2.5D visualization and interaction panel. | 1 |
| 15:36, 9 November 2007 | Clipboard02.jpg (file) | 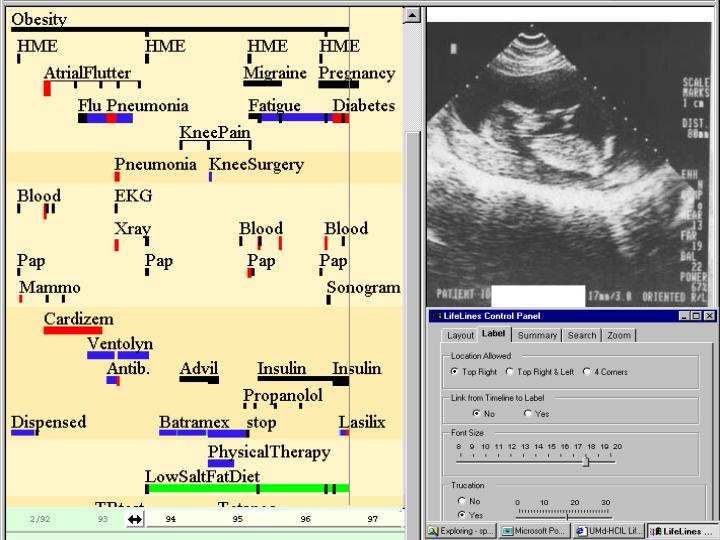 |
64 KB | Figure 3. LifeLines Medical Patient History | 1 |
| 15:35, 9 November 2007 | Clipboard03.jpg (file) |  |
74 KB | Figure 2. Hyperbolic Tree | 1 |
| 15:35, 9 November 2007 | Clipboard01.jpg (file) | 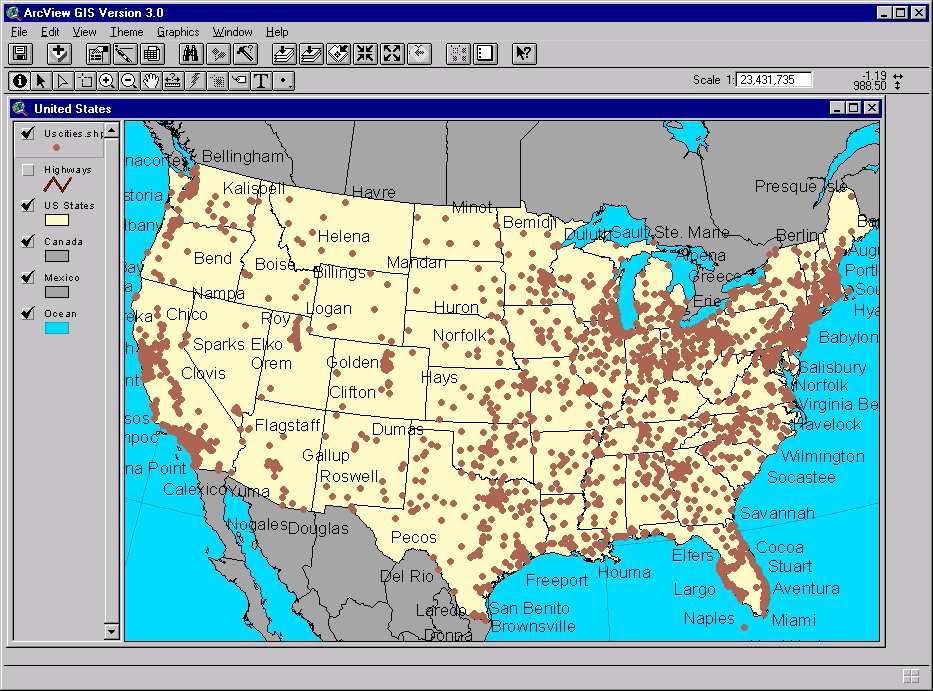 |
153 KB | Figure 1. US Map with City Names | 1 |
| 14:51, 9 November 2007 | Cpof rev2.jpg (file) | 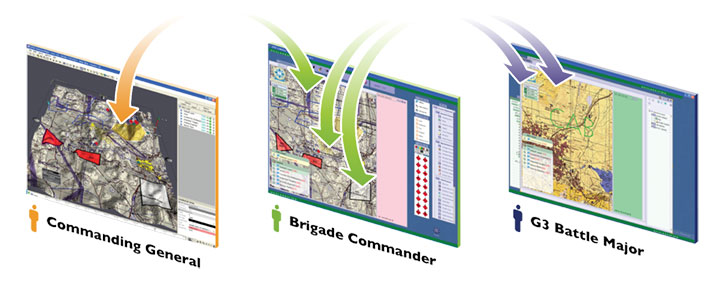 |
49 KB | 1 | |
| 16:09, 3 November 2007 | Runner3.gif (file) |  |
420 bytes | The running figure is the source icon, the arrow in the upper left is the state icon, and the rectangles with the corner folded over indicate a Copy is desired. | 1 |
| 15:48, 3 November 2007 | Img75.png (file) | 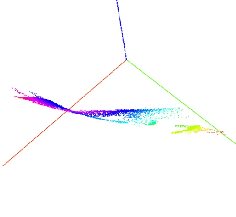 |
6 KB | Pressure (green), absolute-pressure (red), and velocity (blue) result in a surface in 3D (shown from different viewpoints). Obviously the relation between pressure and absolute-pressure is not linear (shown in the right plot). | 1 |
| 10:06, 29 October 2007 | Smal scrat.jpg (file) |  |
83 KB | Scrat | 1 |