Mining and Visualizing Activity Patterns in Social Science Diary Data: Difference between revisions
No edit summary |
No edit summary |
||
| Line 9: | Line 9: | ||
== Figures == | == Figures == | ||
[[Image:Space-time_path.gif]] <br/> | |||
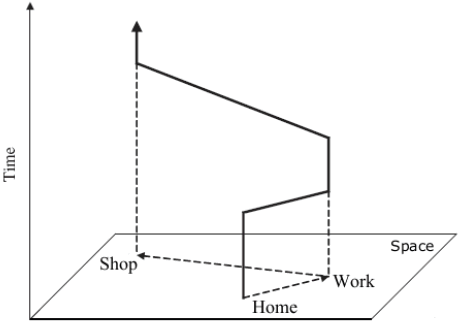
The original time geographical representation of human space-time behaviour. The, so called, ‘space-time path’ is a vertical trajectory representing the movement of an individual in space and time.<br/> | The original time geographical representation of human space-time behaviour. The, so called, ‘space-time path’ is a vertical trajectory representing the movement of an individual in space and time.<br/> | ||
[[Image: | [[Image:RealTimeUseRepresentation.gif]] <br/> | ||
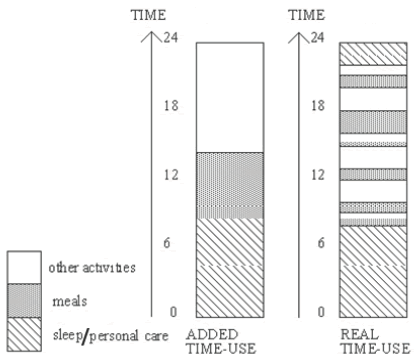
Traditionally time-use studies use representations that account for the accumulated time used for activities during the day. This ‘added time-use’ representation, seen in the left, hides information that may be important to a social scientist, for example when during the day an activity occurs, how many times per day and for how long. The ‘real time-use’ representation, seen in the right, clearly reveals this information.<br/> | |||
[[Image:TimePAcTSActivityPathes.gif]] <br/> | |||
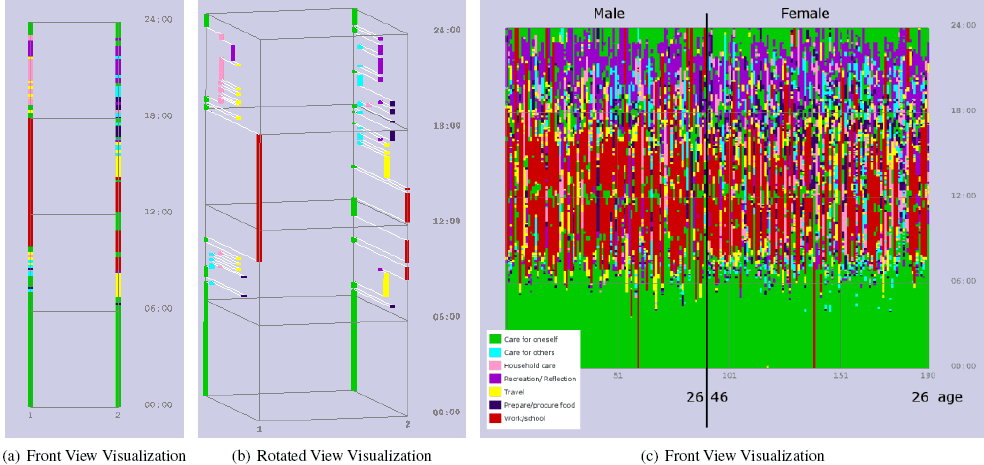
Visualizations in the Visual-TimePAcTS framework. (a) shows the activity paths of a couple viewed from the front. This view is the ‘real time-use’ representation showing the switch between activities performed during a work day. (b) shows a slightly rotated view of the activity paths where the ‘movement’ between the activities and hence the similarity to the original ‘space time path’ becomes clear. (c) shows the front view visualization, which is the ‘real time-use’ representations, of a population subset in the visualization framework. Time is shown in the y-axis and the individuals are ordered along the x-axis by age and gender. Colours represent the 7 activity categories.<br/> | |||
Revision as of 09:24, 23 April 2008
Authors
- Katerina Vrotsou
- Kajsa Ellegård
- Matthew Cooper
Short description
Figures
The original time geographical representation of human space-time behaviour. The, so called, ‘space-time path’ is a vertical trajectory representing the movement of an individual in space and time.
Traditionally time-use studies use representations that account for the accumulated time used for activities during the day. This ‘added time-use’ representation, seen in the left, hides information that may be important to a social scientist, for example when during the day an activity occurs, how many times per day and for how long. The ‘real time-use’ representation, seen in the right, clearly reveals this information.
Visualizations in the Visual-TimePAcTS framework. (a) shows the activity paths of a couple viewed from the front. This view is the ‘real time-use’ representation showing the switch between activities performed during a work day. (b) shows a slightly rotated view of the activity paths where the ‘movement’ between the activities and hence the similarity to the original ‘space time path’ becomes clear. (c) shows the front view visualization, which is the ‘real time-use’ representations, of a population subset in the visualization framework. Time is shown in the y-axis and the individuals are ordered along the x-axis by age and gender. Colours represent the 7 activity categories.
Suitable Datatypes
Important Citations
Evaluation
Internal Links
External Links
References
[Vrotsou K., Ellegård K., Cooper M.] Mining and Visualizing Activity Patterns in Social Science Diary Data. In: Information Visualization, 2007. IV '07. 11th International Conference, pages 130-138, Zurich, Switzerland, 2007.


