File:UE-InfoVis1011 0508080img exp2 1.jpg: Difference between revisions
Jump to navigation
Jump to search
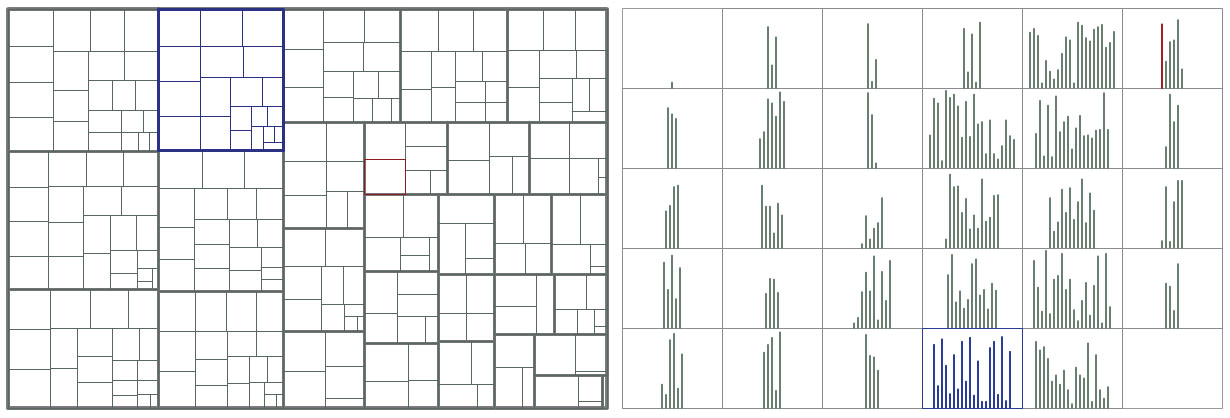
(Fig. 9. Example Exp. 2 stimuli with 256 leaves. (a) Squarified treemap. (b) Hierarchical bar chart; each bar represents a leaf node and sibling bars are grouped together in a cell. The charts depict the same data.) |
(No difference)
|
Revision as of 00:03, 17 November 2010
Summary
Fig. 9. Example Exp. 2 stimuli with 256 leaves. (a) Squarified treemap. (b) Hierarchical bar chart; each bar represents a leaf node and sibling bars are grouped together in a cell. The charts depict the same data.
Copyright status
Source
Nicholas Kong, Jeffrey Heer, Maneesh Agrawala. Perceptual Guidelines for Creating Rectangular Treemaps. IEEE Transactions on Visualization and computer Graphics, 16(6):990-998, November/December 2010.
File history
Click on a date/time to view the file as it appeared at that time.
| Date/Time | Thumbnail | Dimensions | User | Comment | |
|---|---|---|---|---|---|
| current | 00:03, 17 November 2010 | 1,230 × 418 (101 KB) | UE-InfoVis1011 0508080 (talk | contribs) | Fig. 9. Example Exp. 2 stimuli with 256 leaves. (a) Squarified treemap. (b) Hierarchical bar chart; each bar represents a leaf node and sibling bars are grouped together in a cell. The charts depict the same data. |
You cannot overwrite this file.
File usage
The following page uses this file: