File:Midgaard hybrid.jpg: Difference between revisions
Jump to navigation
Jump to search
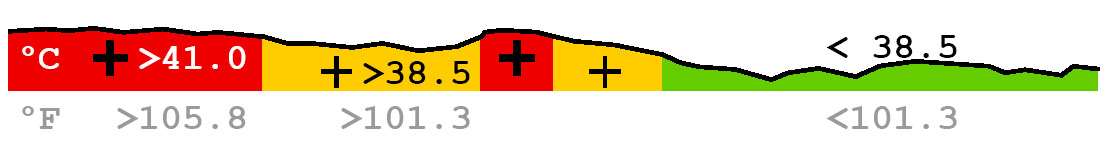
(Qualitative - Quantitative Hybrid: the fever curve is enhanced with color-coded qualitative regions.) |
(No difference)
|
Revision as of 19:05, 26 May 2009
Summary
Qualitative - Quantitative Hybrid: the fever curve is enhanced with color-coded qualitative regions.
Copyright status
Source
[Bade et al., 2004] Ragnar Bade, Stefan Schlechtweg, and Silvia Miksch. Connecting Time-oriented Data and Information to a Coherent Interactive Visualization. In Proceedings of the SIGCHI Conference on Human Factors in Computing Systems (CHI 04), pages 105–112, Vienna, Austria, ACM Press, April 2004. (pdf)
File history
Click on a date/time to view the file as it appeared at that time.
| Date/Time | Thumbnail | Dimensions | User | Comment | |
|---|---|---|---|---|---|
| current | 19:05, 26 May 2009 | 1,105 × 154 (41 KB) | UE-InfoVis09-05 (talk | contribs) | Qualitative - Quantitative Hybrid: the fever curve is enhanced with color-coded qualitative regions. |
You cannot overwrite this file.
File usage
The following page uses this file: