File:Contour map.png
Size of this preview: 800 × 578 pixels. Other resolution: 1,280 × 924 pixels.
Original file (1,280 × 924 pixels, file size: 25 KB, MIME type: image/png)
File history
Click on a date/time to view the file as it appeared at that time.
| Date/Time | Thumbnail | Dimensions | User | Comment | |
|---|---|---|---|---|---|
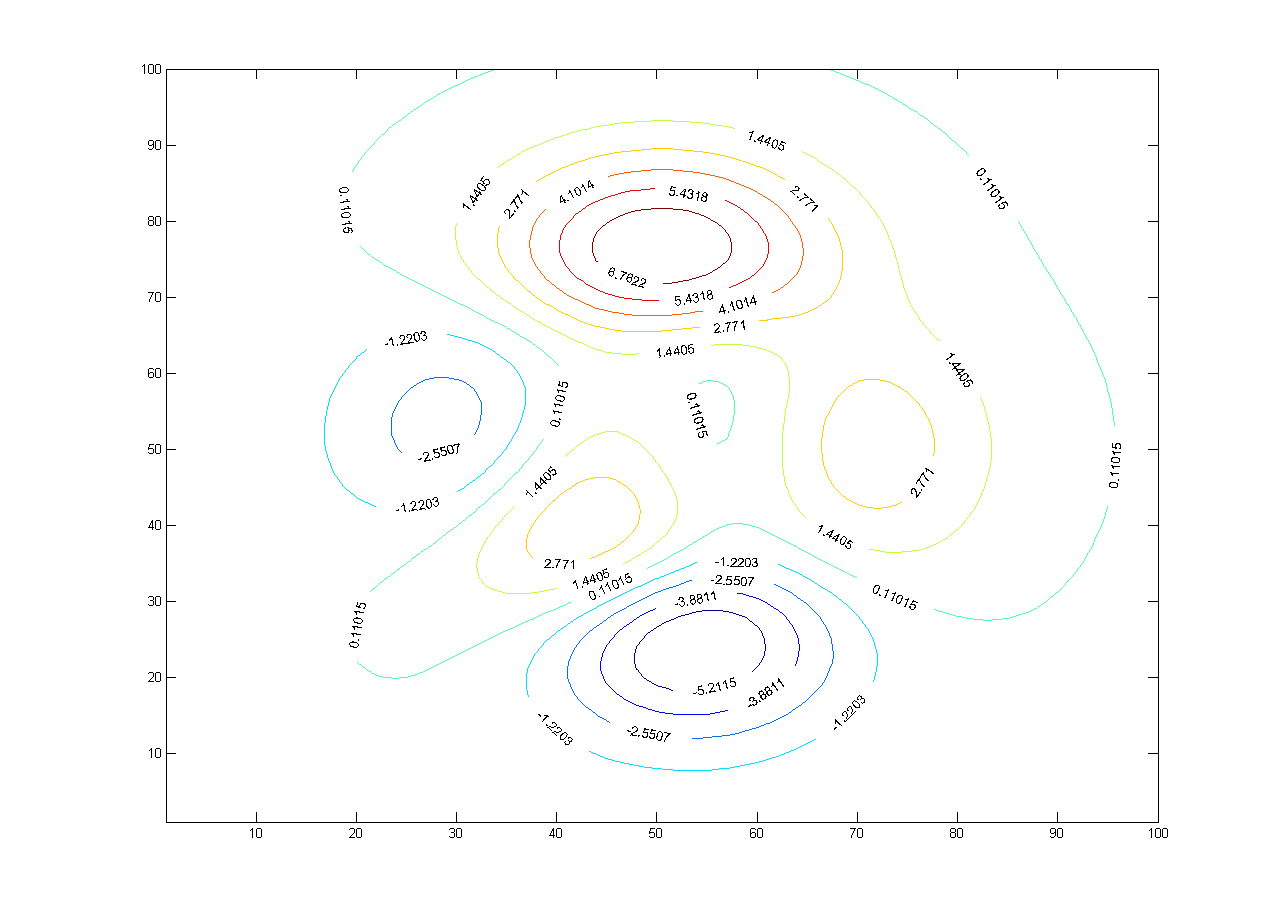
| current | 11:16, 30 October 2008 | | 1,280 × 924 (25 KB) | UE-InfoVis0809 0426276 (talk | contribs) | A contour map contains multiple contour lines. Each line represents a constant level within the map. |
You cannot overwrite this file.
File usage
The following page uses this file: