Teaching:TUW - UE InfoVis WS 2009/10 - Gruppe 06 - Aufgabe 3
Aufgabenstellung
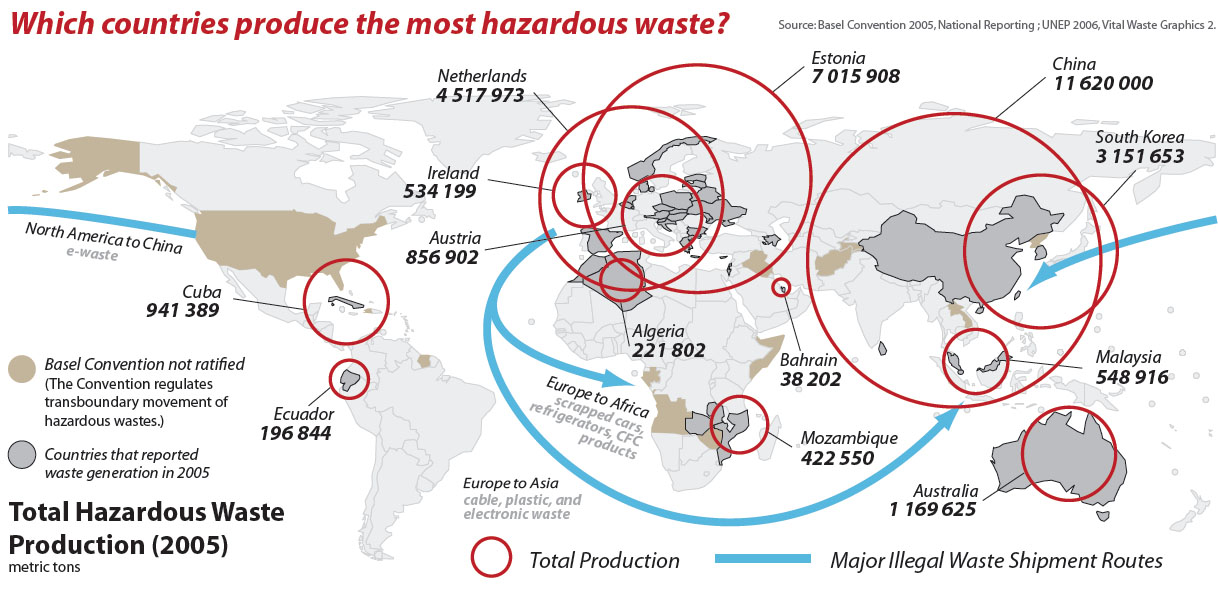
Zu verbessernde Grafik
Critique about the Graph
- data ink ratio is very high
- The world map is not really necessary (except for showing the shipment routes)
- The circles are overlapping
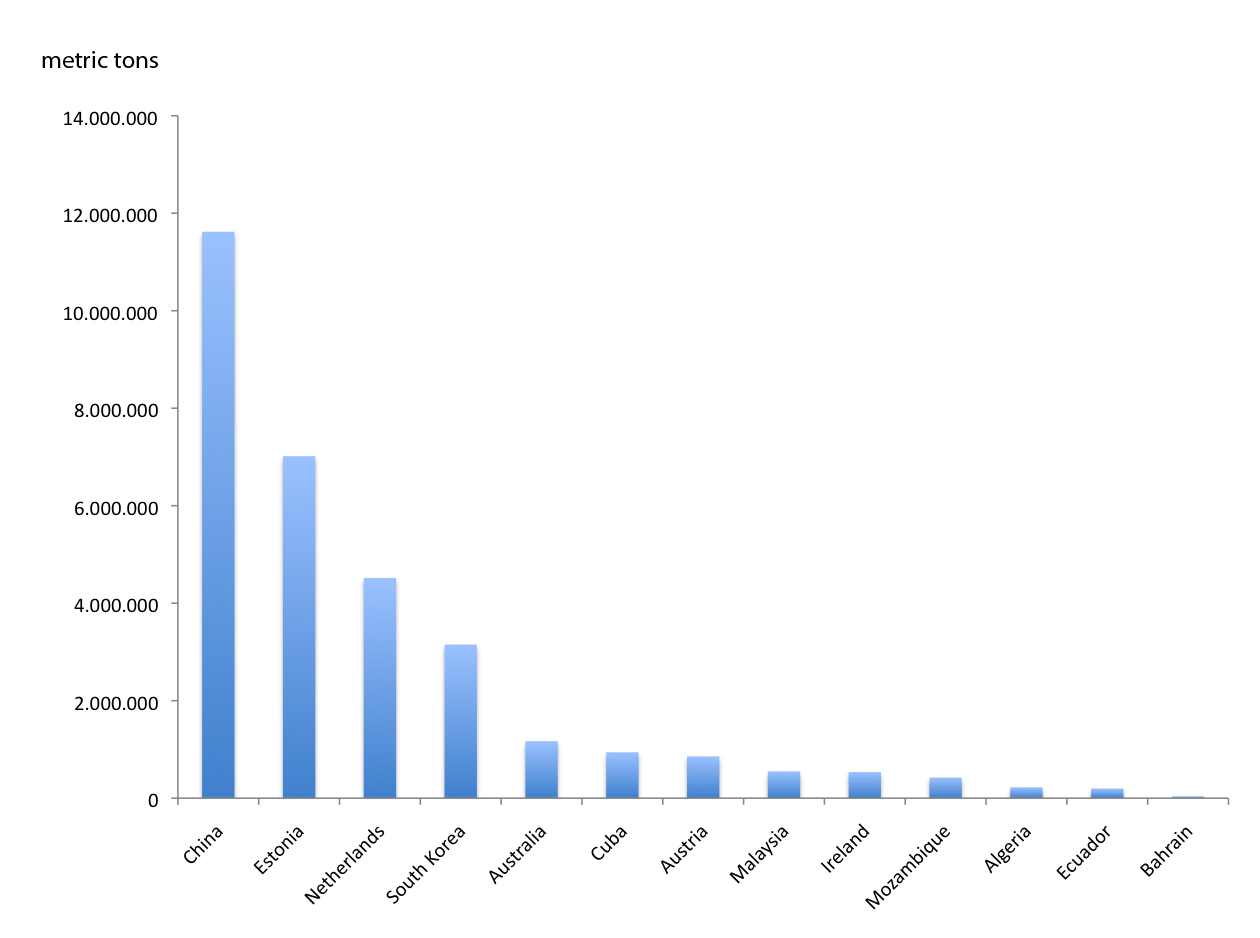
- The values are not ordered (because they are shown on the map)

