Teaching:TUW - UE InfoVis WS 2007/08 - Gruppe 08 - Aufgabe 1 - Spatial Analysis

Definition
Description
Spatial analysis is the process creating visual images or models from data to help understand or interpret that data. The data has to refer to a phenomena distributed in some form of space, this could for example be data relating to physical locations on a map. It is therefore frequently used as a tool for statistical and geographical purposes, such as to create predictions or evaluating the suitibility of a particular location for a purpose. [Wood, 1984]
Examples
A typical approch to get new information from existant data using spatial analysis is to find patterns and correlations in the data by mapping them with their geographic location. The example below illustrates this. The first illustration shows a table of earthquake data. By visualising this data one can better understand it (see figure 2) but one can gain even more useful knowledge with spatial analysis, for example by filtering out the smaller earthquakes and then combining the larger earthquakes (see figure 3). [Pratt, 2003]
-
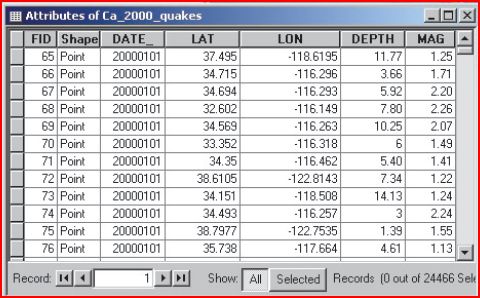
Figure 1
-
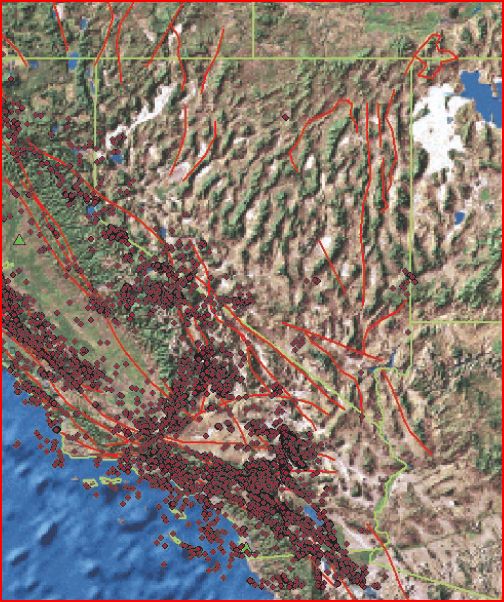
Figure 2
-
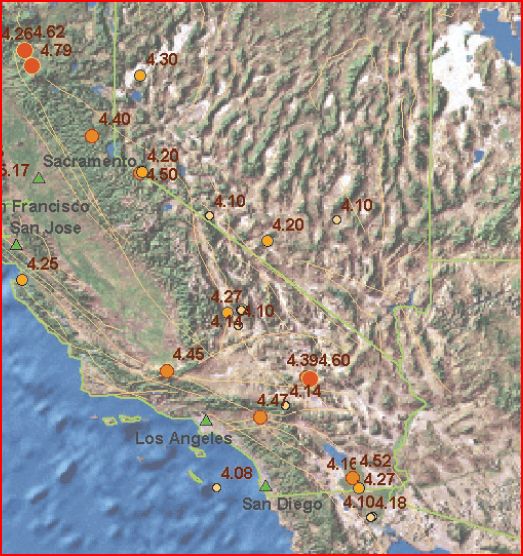
Figure 3


References
- [Green, 2006] Richard Green, MCAG GIS: - Glossary of GIS Terms. Created at: December 21, 2006. Retrieved at: November 8, 2007. http://www.mcaggis.com/Glossary.html#S
- [Pratt, 2003] Monica Pratt. Beginning spatial Analysis. ArcUser, October-December 2003: 58-59, October 2003
- [Wood, 1984] Stearns J. Wood, GIS Glossary h-t. Created at: 1984. Retrieved at: November 8, 2007. http://www.pcmag.com/encyclopedia_term/0,2542,t=GIS+glossary+h-t&i=43796,00.asp