Teaching:TUW - UE InfoVis WS 2009/10 - Gruppe 09 - Aufgabe 3
Aufgabenstellung
Zu verbessernde Grafik
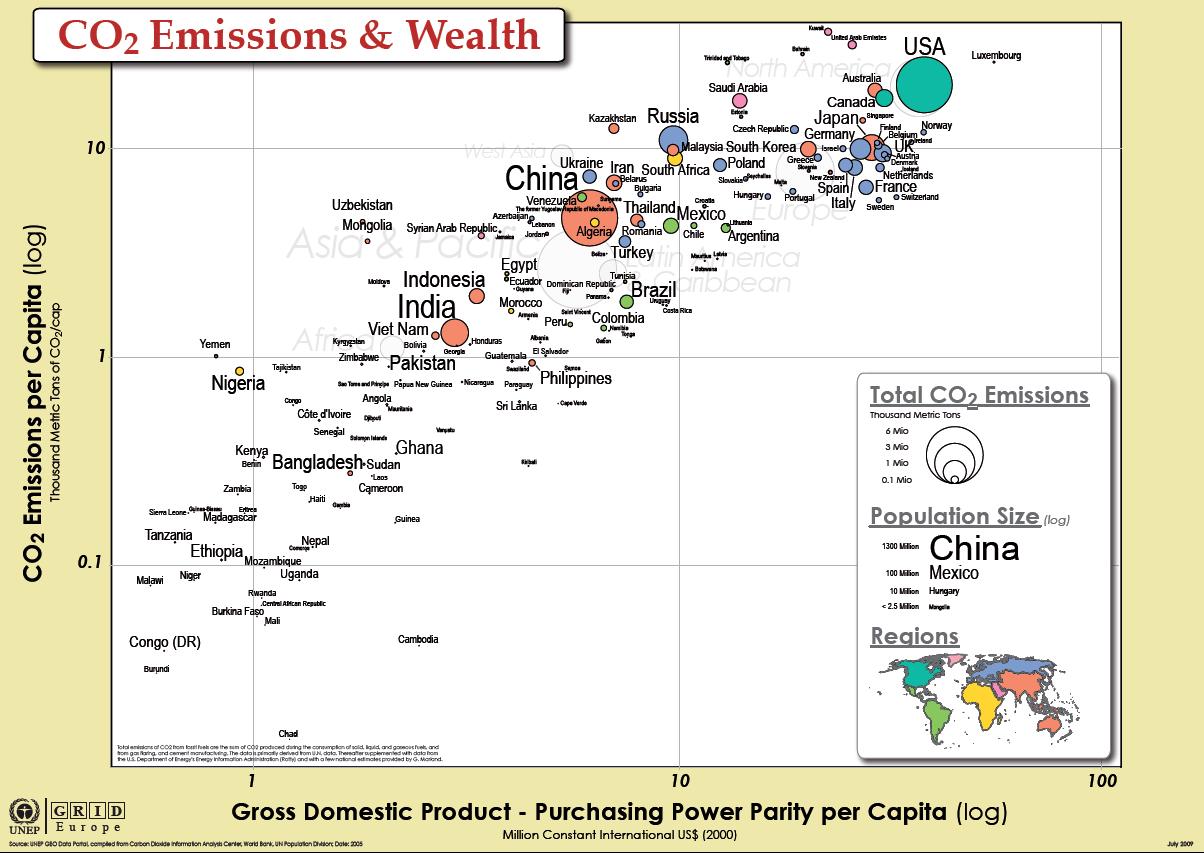
Review of the Existing Graphic
- Non-data-ink should be reduced to no more than what is necessary to make the data ink understandable [Few, 2004]. Examples of non-data-ink, which should be removed from the graphic:
- The yellow/brown border around the real graphic
- border lines
- The light gray fonts in the background of the graphic
- Next unnecessary data ink should be subtracted. Because the main topic of this graphic is to recognize the connection between the Co2-Emission (total and per capita) of some countries and their gross domestic product. And so I think it is unnecessary to make a distinction in view of region because it’s clear that Brazil belongs to South America and Italy to Europe. Furthermore the distinction of regions carries no additional information in view of the overall topic. The aim is to give the readers of the graphic what they need, and all that they need, but nothing more [Few, 2004]. In addition information which is peripheral to the interests and purposes of the readers should be removed [Few, 2004].
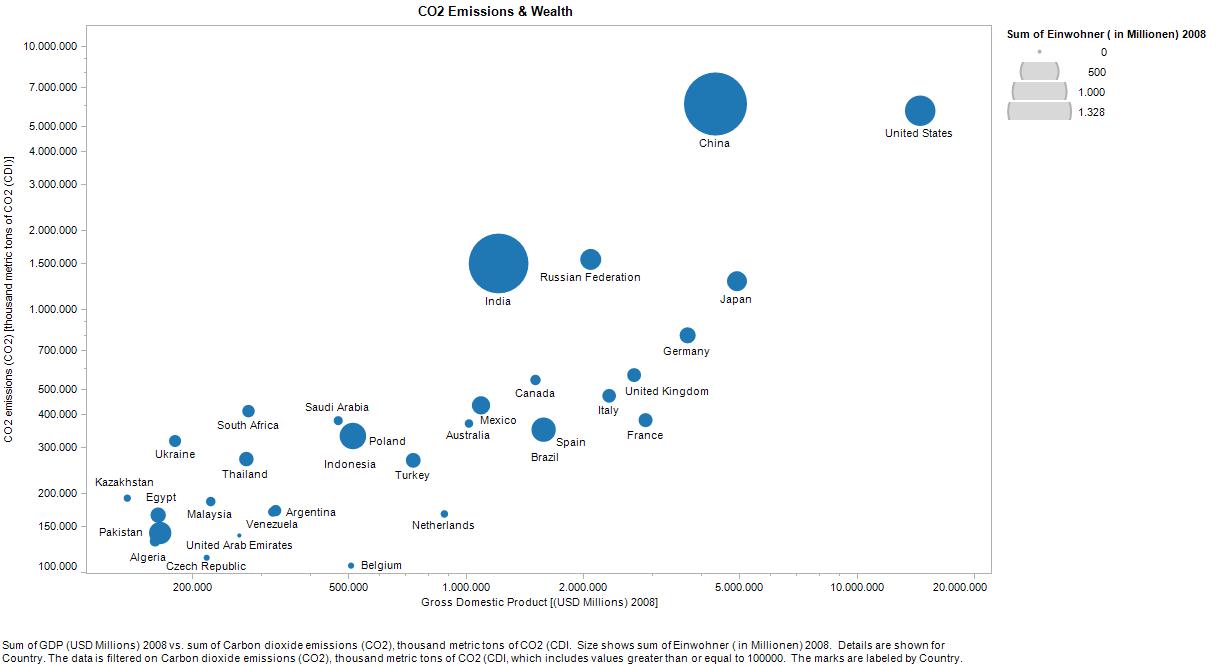
- The next point of criticism relates to the fact that every designer must be carefully avoid saying too little by trying to say too much [Few, 2004]. As a result of this statement only countries which have a certain amount of Co2-Emission should be displayed in the graphic.
Improvements
- Now the graphic visualizes the most important countries in view of the CO2-Emission
- Furthermore the user is now able to differ between the various countries in a better way because there aren't so much
entries which overlap other ones.
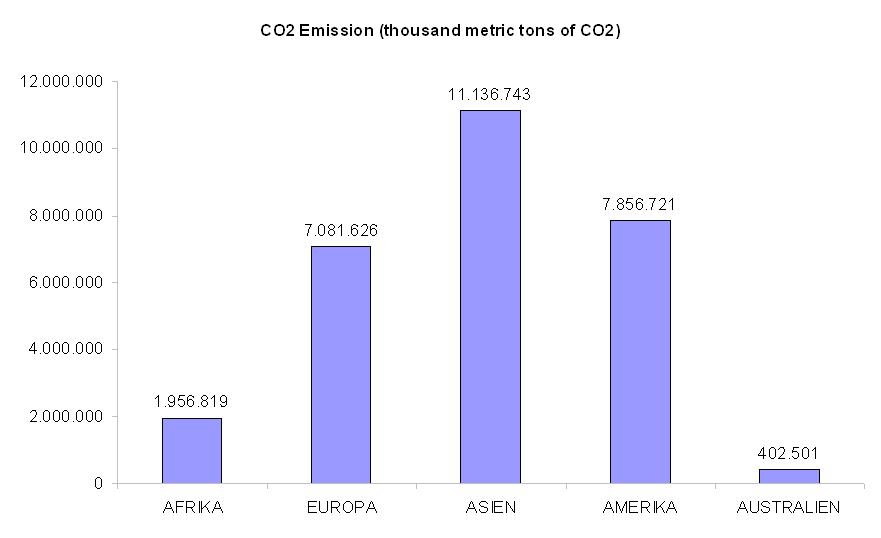
- The information in view of the region is separated in another barplot. So the user has an overview of the regional CO2-Emissions
Referenzen
[Few, 2004] Stephen Few. Show Me the Numbers: Designing Tables and Graphs to Enlighten. Analytics Press, 2004, Chapter 7 – General Design For Communication
CO2 Emissions data set: http://manyeyes.alphaworks.ibm.com/manyeyes/datasets/carbon-dioxide-emissions-co2-thousan-2/versions/1
http://manyeyes.alphaworks.ibm.com/manyeyes/datasets/carbon-dioxide-emissions-co2-kg-co/versions/1


