Evaluating Information Visualization Applications
Author
Short Description
Figures
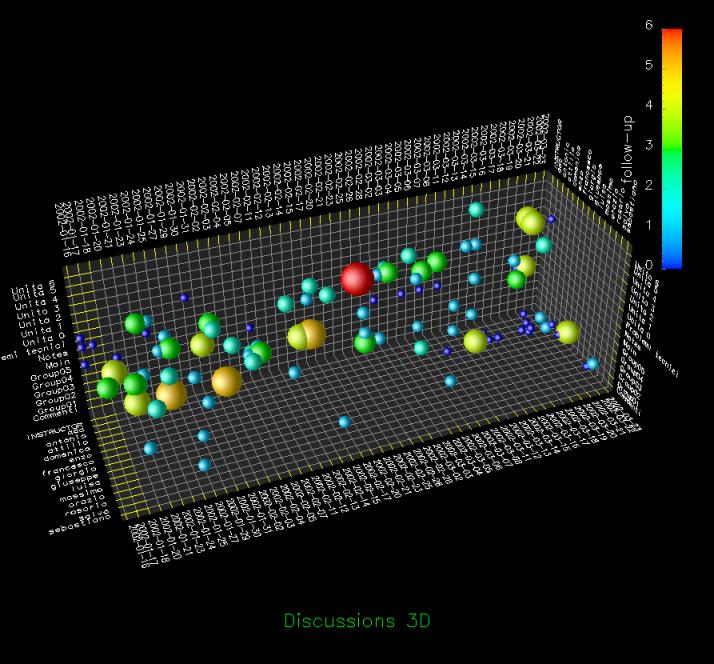
Discussion Plot:
This Plot is about the disussions of the course. It shows time, topics and students.

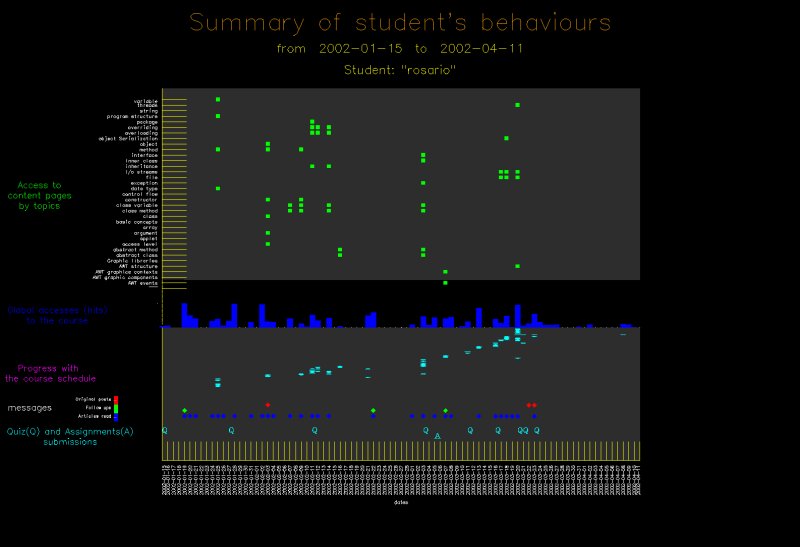
Behavioural Graph:
This graph represents the behaviours of a single student.
It shows the student's access to the content pages, the global access to the course, a progress with the schedule of the course, messages and the submission of quizzes and assignments.

Important Citation
attitudes, feelings and beliefs ... are more likely to be revealed
via the social gathering and the interaction which being in a focus
group entails [A. Gibbs, 1997]
formulate and answer questions [users] didn’t anticipate having
before looking at the visualization
[C. Plaisant, 2004]