File:Perceptualedge03slicerdicer.gif
Perceptualedge03slicerdicer.gif (623 × 459 pixels, file size: 18 KB, MIME type: image/gif)
Summary
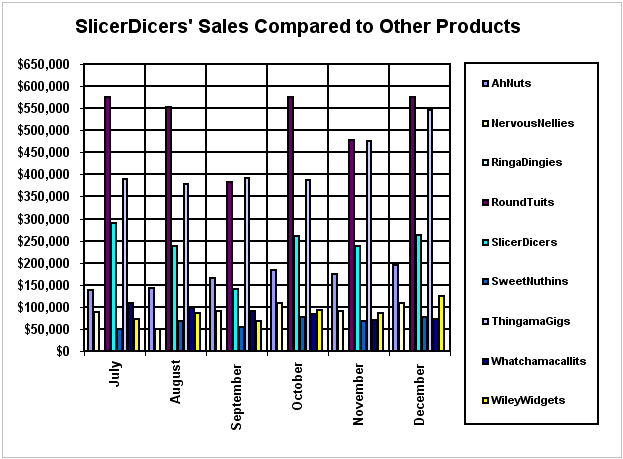
Here we have got an example for a low data-ink ratio. The data-ink ratio is the proportion of the ink that is used to present actual data, without redundancy, compared to the total amount of int used in the entire display. The goal is to receive the highest possible data-ink ration (a value close to 1.0 or 100%). The data-ink ratio is defined as the percentage: (100*data-ink)/(total ink used on the graph)
Copyright status
Source
[Perceptual Edge, 2003] Perceptual Edge, SlicerDicer's Sales Compared to Other Products, Design Example #6. Created at: 2003. Retrieved at: Oct. 10, 2005
File history
Click on a date/time to view the file as it appeared at that time.
| Date/Time | Thumbnail | Dimensions | User | Comment | |
|---|---|---|---|---|---|
| current | 08:43, 25 October 2005 |  | 623 × 459 (18 KB) | Iwolf (talk | contribs) | Bar Chart of SlicerDicer's Sales Compared to Other Products |
You cannot overwrite this file.
File usage
The following page uses this file: