Internet Relay Chat
Author
Short description
Internet Relay Chat (IRC) is a system, which is used by two or more persons in order to collaborate and chat in real-time from anywhere in the world.
IRC users can not only send messages directly between each other, but also join a set of channels (formed by users with a common interest) and send messages that all users in the channel can see.
The aim of this paper is to describe a method of inferring the social network of several IRC users in a channel and producing visualizations of the resulting data.
- The first step of the method is the "Social Network Analysis". It consists in measuring the relationships and flows between users and entities. These results come from an IRC robot. It permits to monitor a channel and to carry out a heuristic analysis of events.
- The second step is the "Visualization of the Social network". In fact, a representation of this mathematical analysis allows to determine and see easily different facts of the Social Network. So in order to visualize the social network, there are several stages to do:
- The first one is called "Inferring the Social Network". We have to infer the approximate mathematical representation to obtain a social network derived from the heuristics. There is a lot of methods to infer relationships in the graph:
- The first one is called "Inferring the Social Network". We have to infer the approximate mathematical representation to obtain a social network derived from the heuristics. There is a lot of methods to infer relationships in the graph:
- Monitoring occurrences of direct addressing (specification of the user nickname)
- Temporal Proximity (determination of question/response and so the link between two users by analysing the time between the messages)
- Temporal Density (determination of a conversation between two users by examining the messages frequency and their author)
- Monitoring Private Messages: not a valid method (Ethical problem and problem of user presence in many channels)
- Monitoring occurrences of direct addressing (specification of the user nickname)
- The second stage is "Examining the Inferred Social Network", that is to say to calculate results and draw conclusions with the help of the graph theoretic structure. Then, it's very practical to deduce conclusions like: the most active user, disconnected social networks...
- The third stage is "Creation of the Visualization" (Drawing Social Networks). It represents which relationships are present and their strength. According to the obtained results, we can make modifications to have the most legible graph : either by using a two or three-Dimensions Visualization or by choosing between the several graph drawing method:The spring embedder or the Modified Spring Embedder Force Model or by limiting the distance of the disconnected networks having used the m-limited Force Model...
Once the visualization was improved, it reveals the structure of the social network and highlights connectivity, clustering and strengths of relationships between users. We also only have to interpret the graph.
Each time that the robot is appealed, it draws a diagram. If the IRC bot stores several sequences, an animation of the evolution of the social network can be obtained after having pieced these together. However it is possible as well to draw a new state of the network from the last stored nodes.
With the same way than in the real life, the bot reduces the weightings of the edges during a relationship is deteriorating because of an prolonged inactivity between the concerned people. Indeed if someone doesn't have anymore activity, he will disappear of the diagram after a while.
Figures
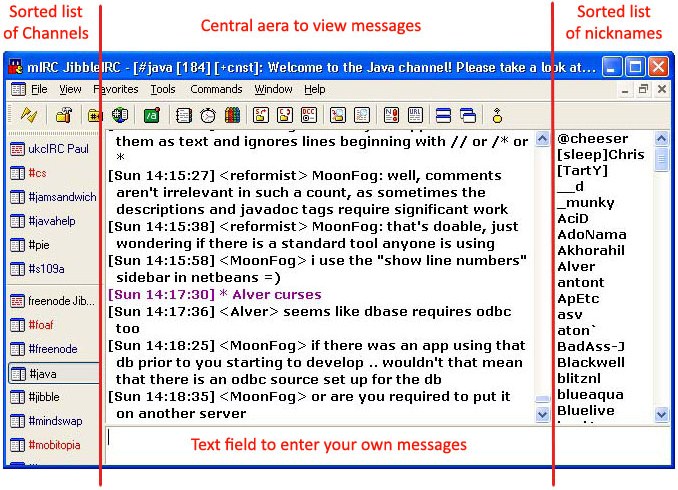
This figure represents the interface of a typical IRC client (with annotations):
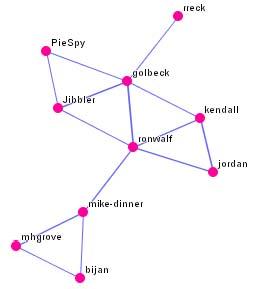
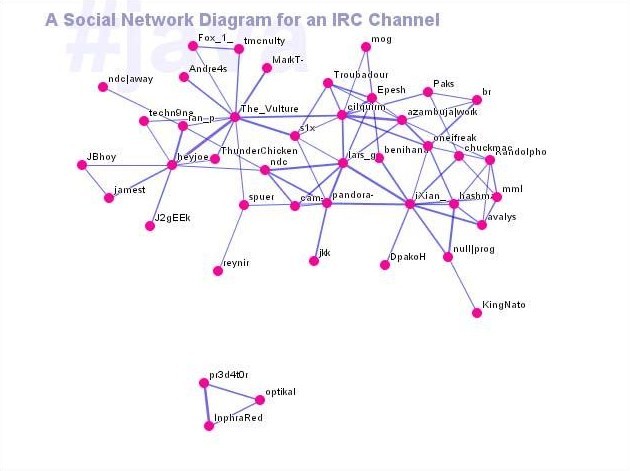
A simple social network is modelling by a graph with nodes and edges linked together, which represent respectively users and users relationship.
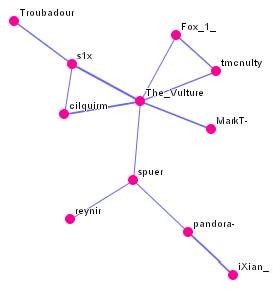
After a short time in the channel #java, we can notice than one of the user "The_Vulture" is like an essential piece of the puzzle: it means that he is in the center of the diagram and of the network as a result. He is linked closely and directly or not to some people, he impacts on the network configuration as well.
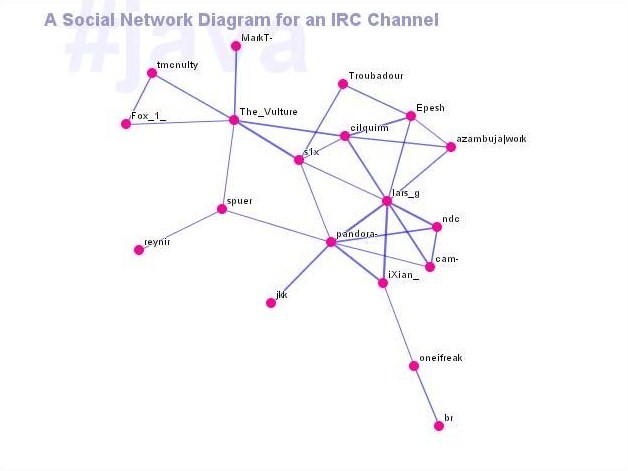
In this figure it is clear that some newcomers like "lars_g" for example stole the central place from "The_Vulture".
Two disconnected social networks are represented in the following figure. The smallest network is constituted by three users who are communicating exclusively each other. The other one, apparently not interested in the three other users, is well-balanced and thanks to the m-limited alteration don't produce a too large diagram.
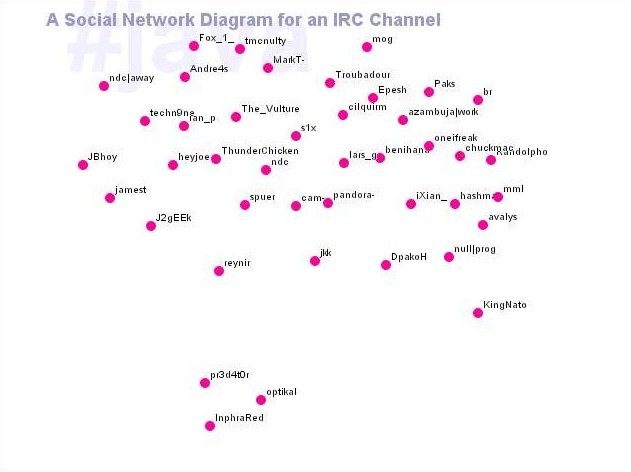
In case of a too big number of participants, it is not absolutely necessary to draw the edges between the node. It is indeed easy to evaluate the importance of relationships by judging the proximity of these nodes as it is shown in this figure.
Important Citations
Suitable Datatypes
The appropriated datatypes are some diagrams or designed graphics.
Evaluation
Advantages:
- Integrating this application in an existing IRC client may allow users to filter irrelevant messages.
- Defining some settings, the configuration of this bot in some very busy channels could be used by participants like a personal spam filter.
- Establishing links between people on the personal homepage of each user
Disadvantages:
- application written in pure Java so that it could be altered
References
[Mutton P.] Inferring and visualizing social networks on Internet relay chat. In: Information Visualization, 2004. IV 2004. Eigth International Conference on Information Visualisation, pages 35-43, Canterbury, United Kingdom, 14-16 July 2004.
Evaluation Reference
[Mutton P.] Inferring and visualizing social networks on Internet relay chat. In: Information Visualization, 2004. IV 2004. Eigth International Conference on Information Visualisation, pages 35-43, Canterbury, United Kingdom, 14-16 July 2004.