File list
Jump to navigation
Jump to search
This special page shows all uploaded files.
| Date | Name | Thumbnail | Size | User | Description | Versions |
|---|---|---|---|---|---|---|
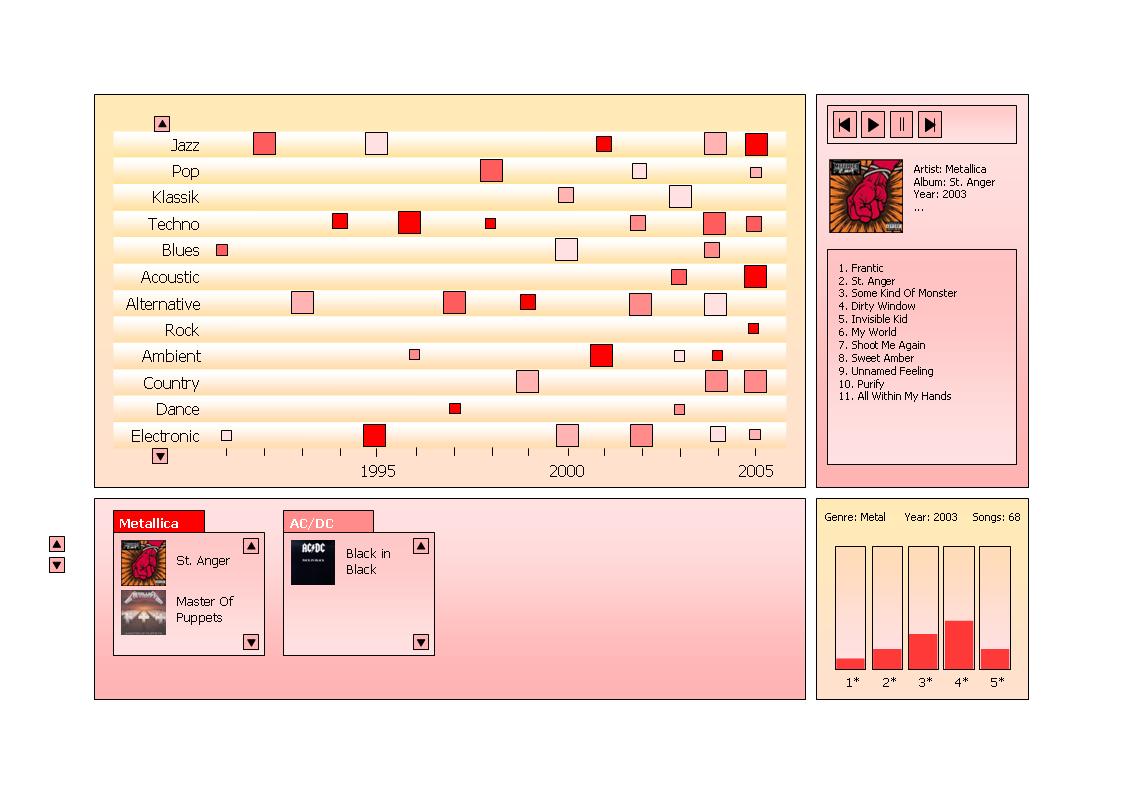
| 07:29, 21 November 2005 | InfoVis Gruppe10 Aufgabe3 Entwurf2.jpg (file) |  |
88 KB | UE-InfoVis0506 0027476 (talk | contribs) | New concept for the genre/year visualisation | 1 |
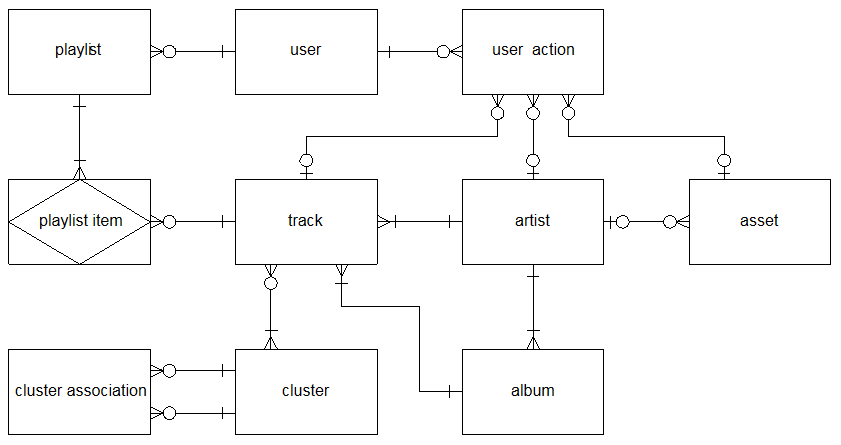
| 17:58, 20 November 2005 | MiceERD.png (file) |  |
8 KB | UE-InfoVis0506 0325693 (talk | contribs) | 7 | |
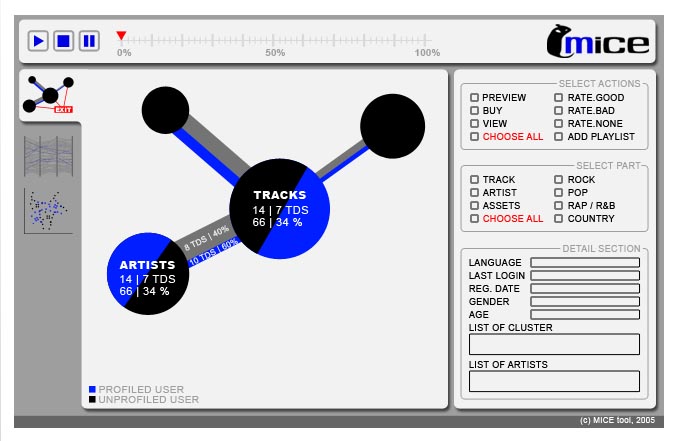
| 21:54, 19 November 2005 | Screenshot2 small.jpg (file) |  |
82 KB | UE-InfoVis0506 0306110 (talk | contribs) | Showing a mockup of the possible lookalike of prototype. | 1 |
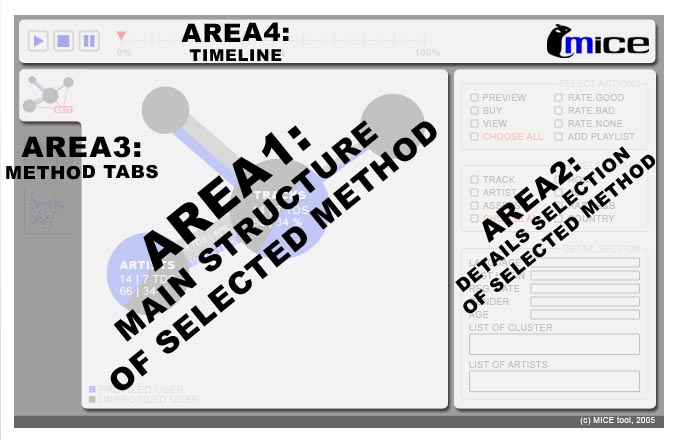
| 21:53, 19 November 2005 | Screenshot2 structure.jpg (file) |  |
85 KB | UE-InfoVis0506 0306110 (talk | contribs) | Giving the basic structure for the prototype for a visualization applet for online music portal data. | 1 |
| 16:58, 17 November 2005 | Infovis weblog.png (file) |  |
90 KB | UE-InfoVis0506 9426777 (talk | contribs) | Diskussionsbeitrag Fake Screenshot | 1 |
| 19:03, 16 November 2005 | InfoVis Gruppe10 Aufgabe3 Entwurf1.gif (file) |  |
13 KB | UE-InfoVis0506 0027476 (talk | contribs) | Entwurf 1 "Screenshot" | 1 |
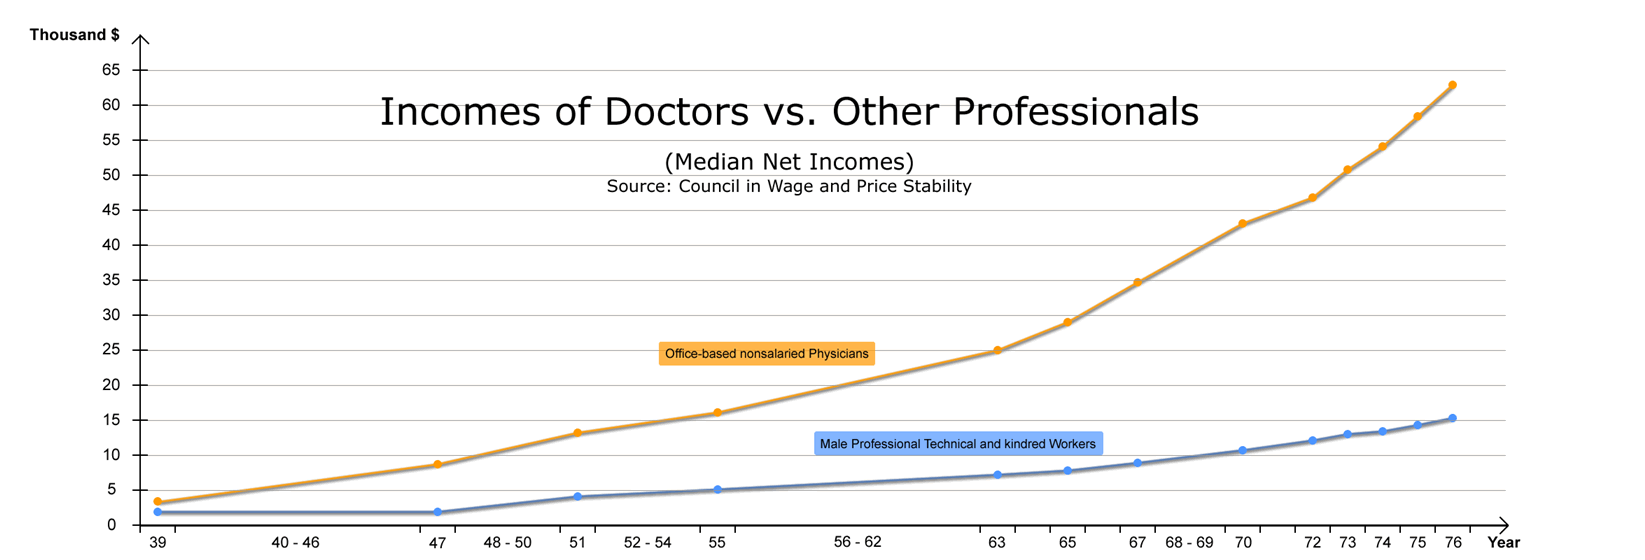
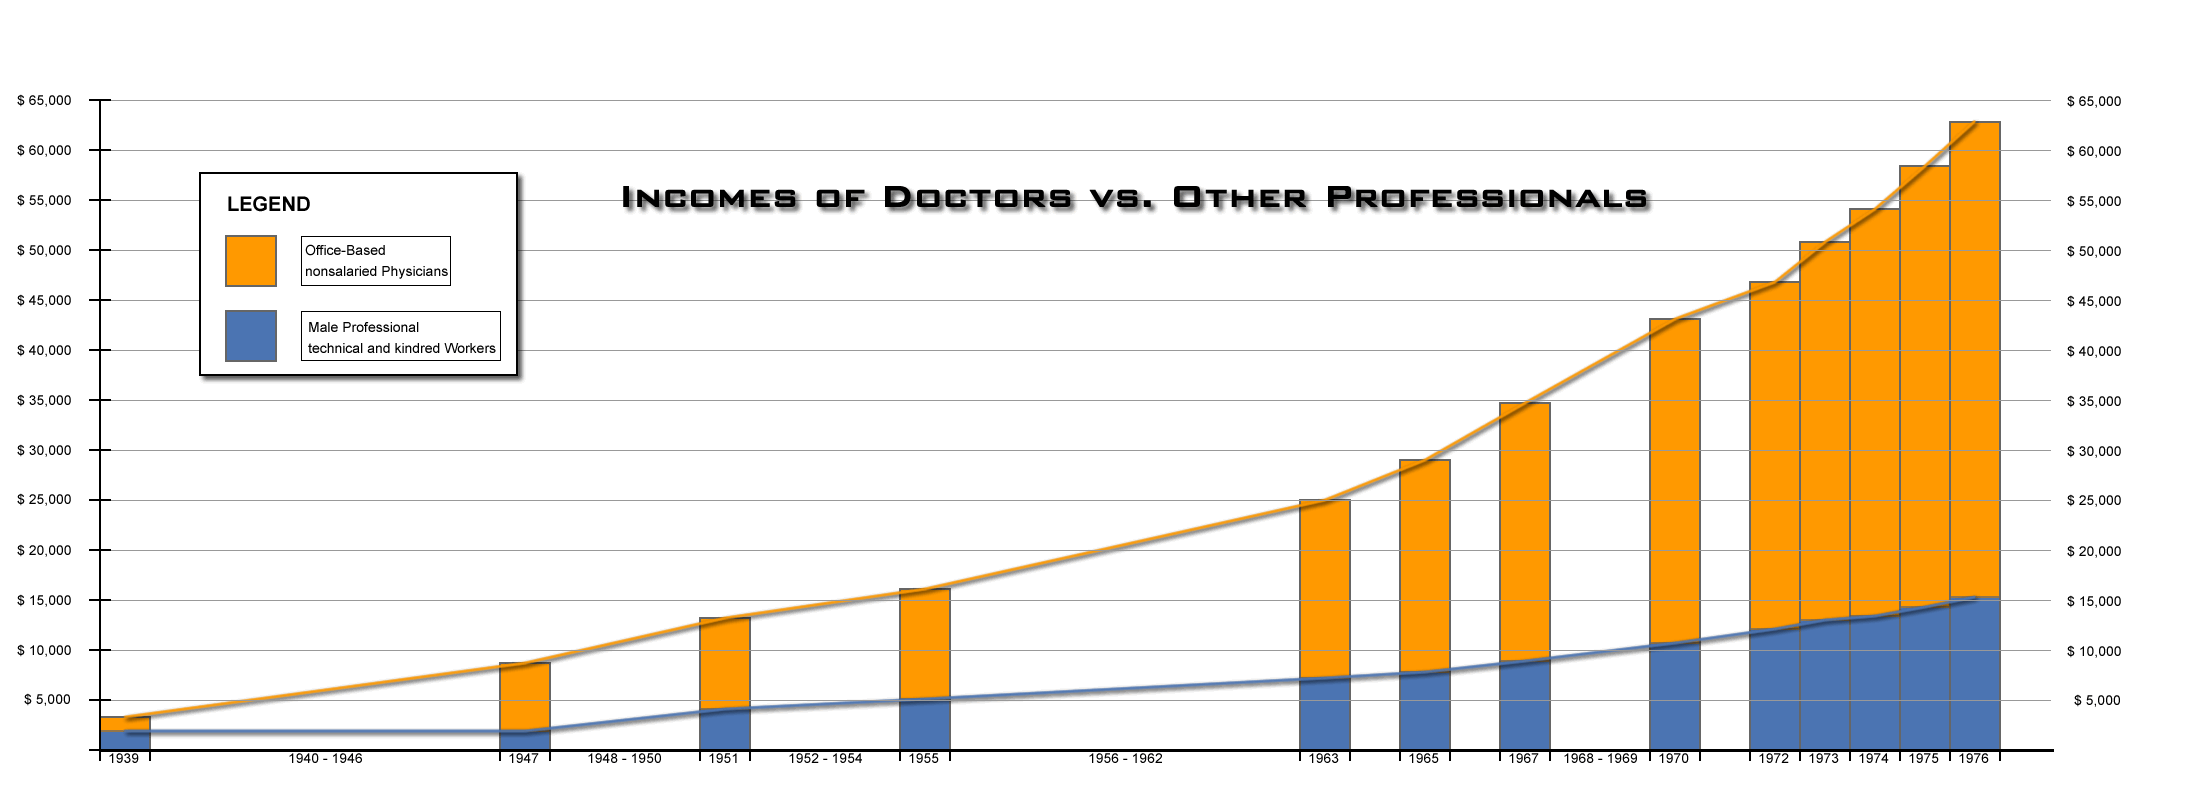
| 12:27, 16 November 2005 | Diagramm 04.png (file) |  |
34 KB | UE-InfoVis0506 0025470 (talk | contribs) | Last Version. Now all points refinded. | 1 |
| 10:03, 16 November 2005 | Diagramm 02.png (file) |  |
37 KB | UE-InfoVis0506 0025470 (talk | contribs) | Refinded version of the graphics. Now all mistakes should be repaired. | 2 |
| 10:01, 16 November 2005 | Diagramm 03.png (file) |  |
37 KB | UE-InfoVis0506 0025470 (talk | contribs) | Refined graphics. Uses line diagramm and all other mistakes are repaired. | 1 |
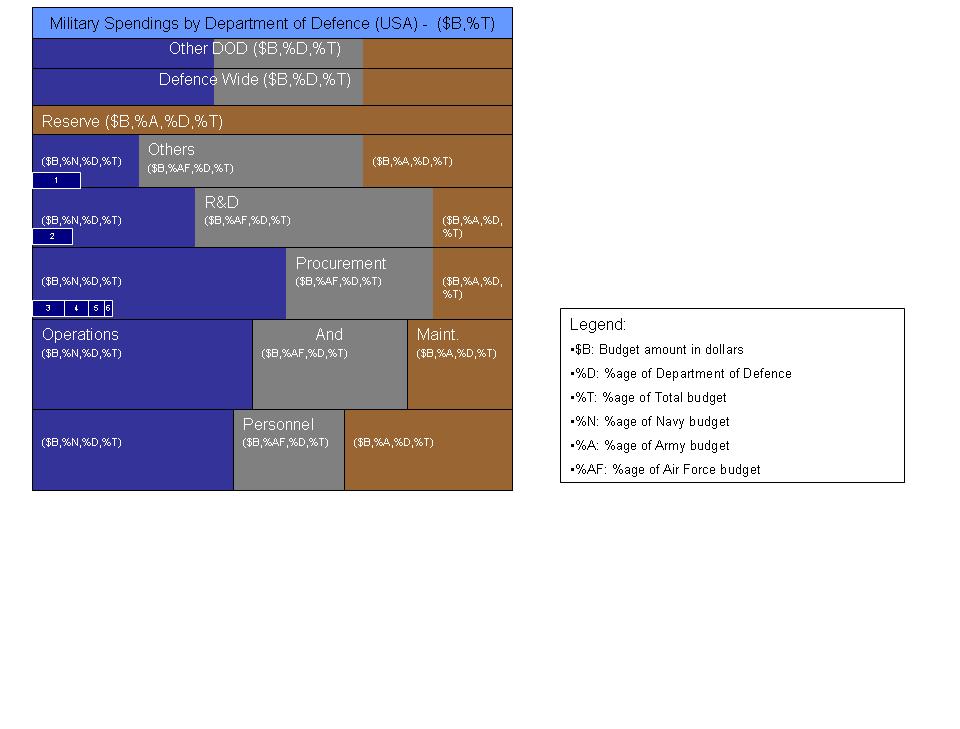
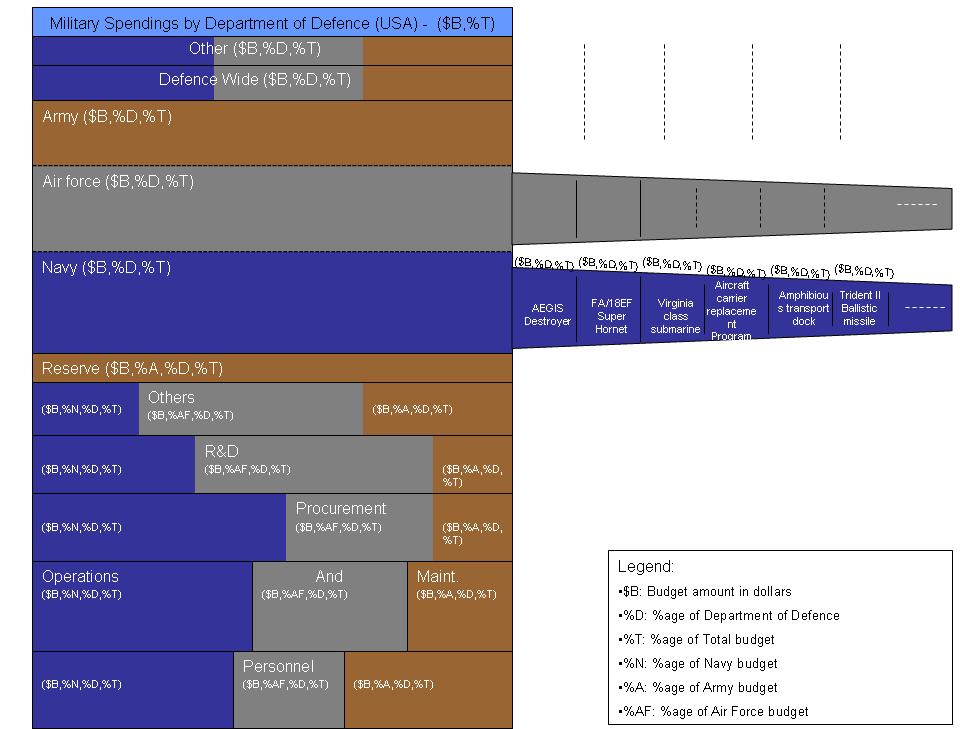
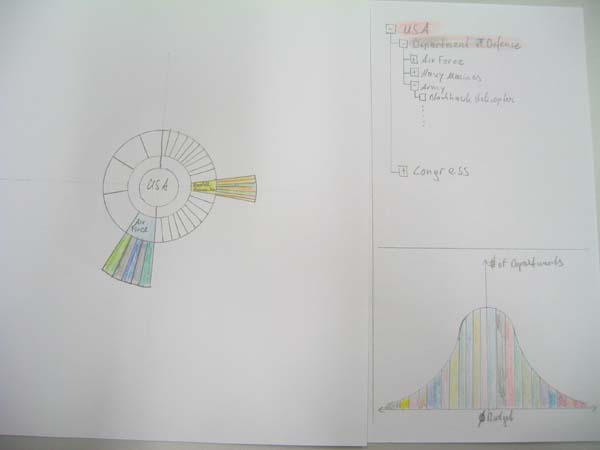
| 22:38, 15 November 2005 | Drawing1.jpg (file) |  |
574 KB | Menace (talk | contribs) | 2 | |
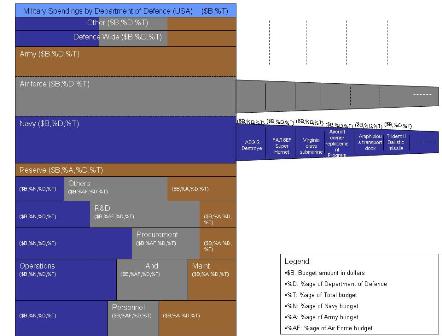
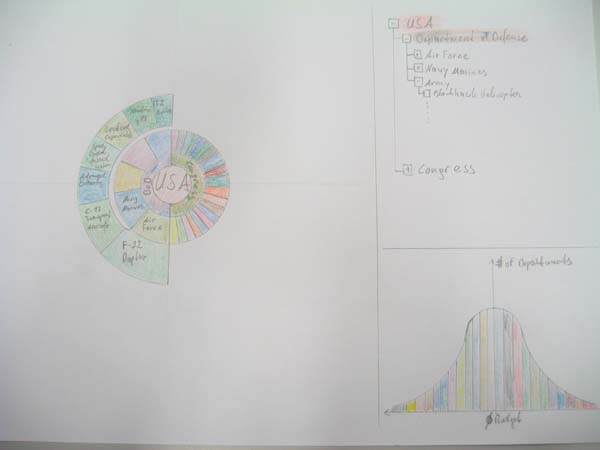
| 22:37, 15 November 2005 | Drawing19.jpg (file) |  |
146 KB | Menace (talk | contribs) | 2 | |
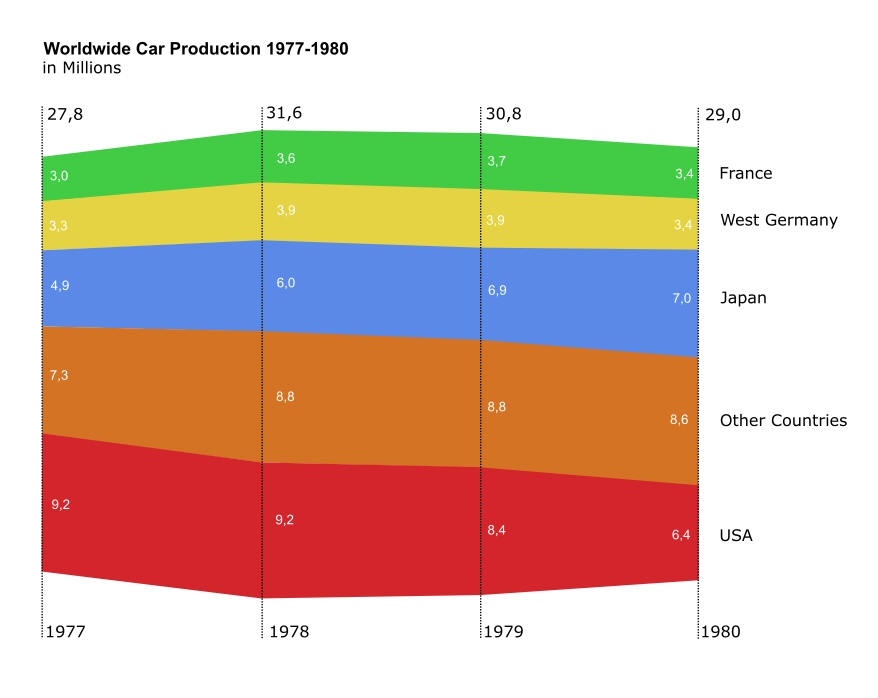
| 09:46, 14 November 2005 | Infovis worldwide car production2.png (file) |  |
41 KB | UE-InfoVis0506 9426777 (talk | contribs) | Worldwide Car Production 1977-80. ThemeRiver without vertical dotted lines. | 1 |
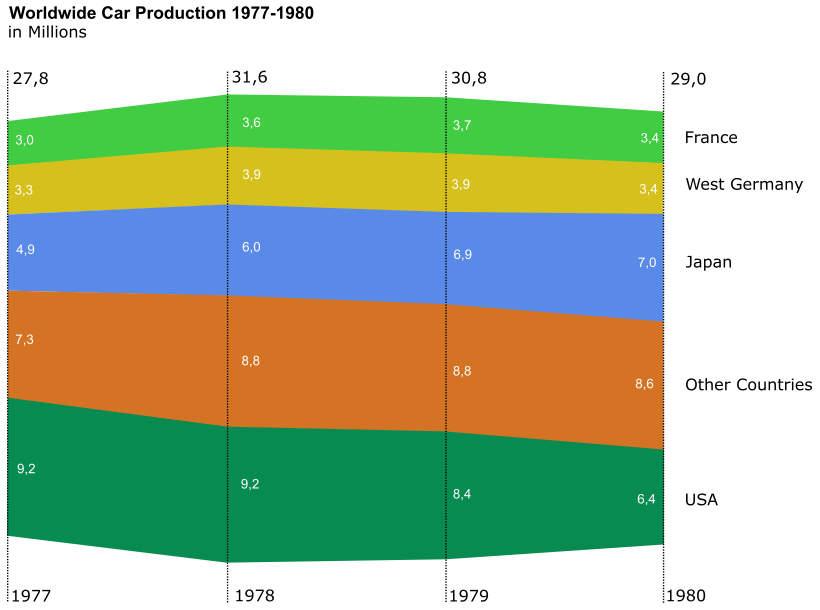
| 09:45, 14 November 2005 | Infovis worldwide car production.png (file) |  |
59 KB | UE-InfoVis0506 9426777 (talk | contribs) | Worldwide Car Production 1977-80. ThemeRiver with vertical dotted lines. | 1 |
| 18:29, 12 November 2005 | MICELogo.gif (file) |  |
6 KB | UE-InfoVis0506 0306110 (talk | contribs) | Logo of MICE - Tool for Exploratory data analysis of music portal usage data. | 1 |
| 10:47, 9 November 2005 | World car production themeriver.jpg (file) |  |
96 KB | UE-InfoVis0506 9426777 (talk | contribs) | Diskussionsbeitrag Themeriver Worldwide car production 1977-1980 | 2 |
| 19:36, 8 November 2005 | Death and taxes visualization - Modified1.jpg (file) |  |
58 KB | UE-InfoVis0506 0327350 (talk | contribs) | 1 | |
| 19:34, 8 November 2005 | Death and taxes visualization - modified1.jpg (file) |  |
22 KB | UE-InfoVis0506 0327350 (talk | contribs) | 3 | |
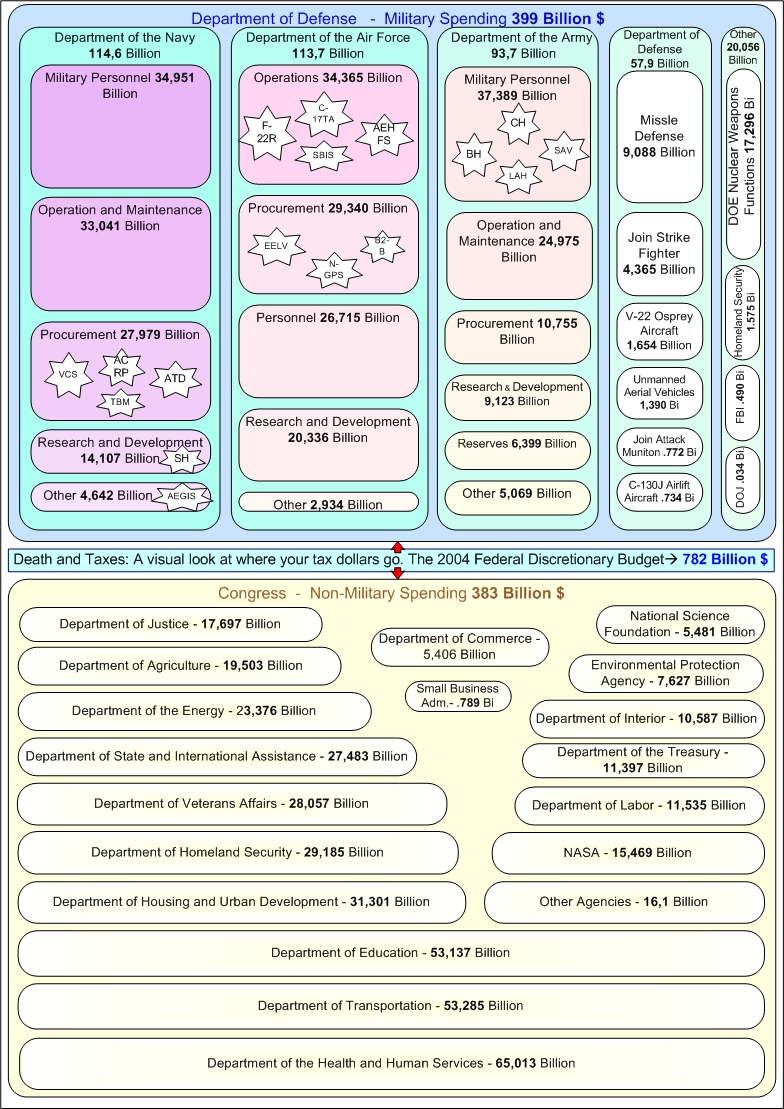
| 08:51, 7 November 2005 | Death and taxes visualization - modified.jpg (file) |  |
81 KB | UE-InfoVis0506 0327350 (talk | contribs) | user summary | 2 |
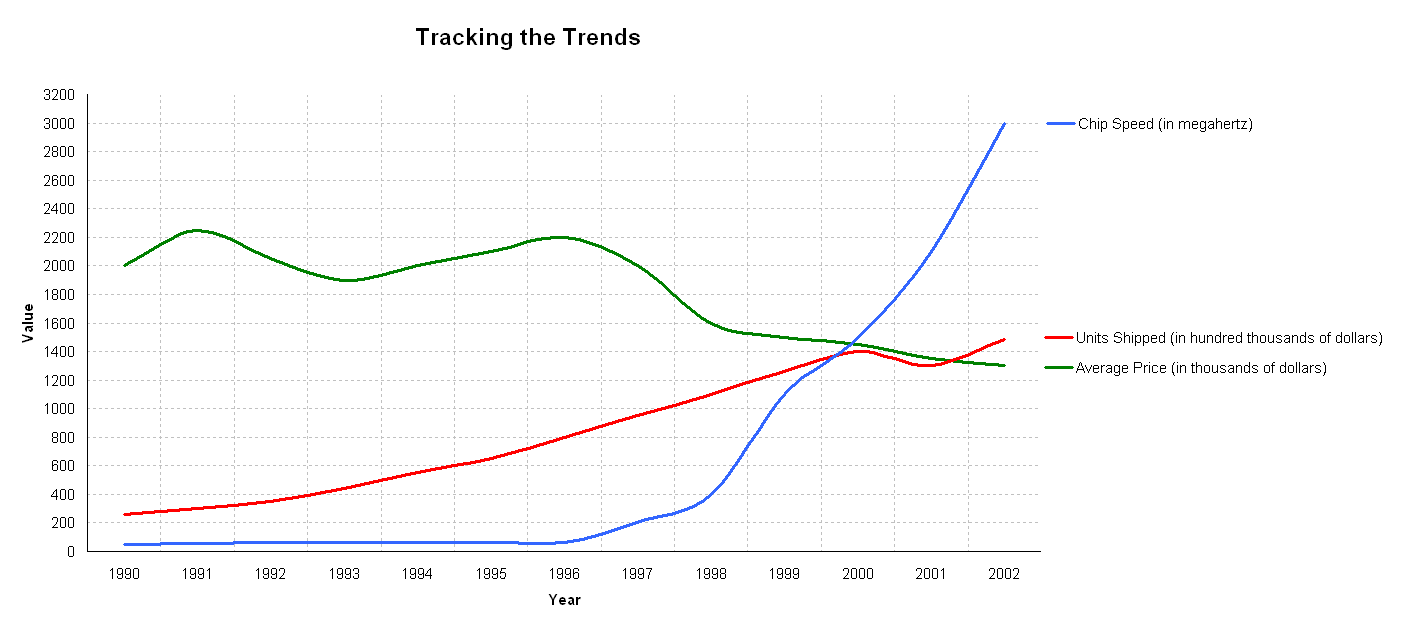
| 15:00, 6 November 2005 | Tracking the Trends.png (file) | 17 KB | UE-InfoVis0506 0225264 (talk | contribs) | Better Graphic of Tracking the Trends | 3 | |
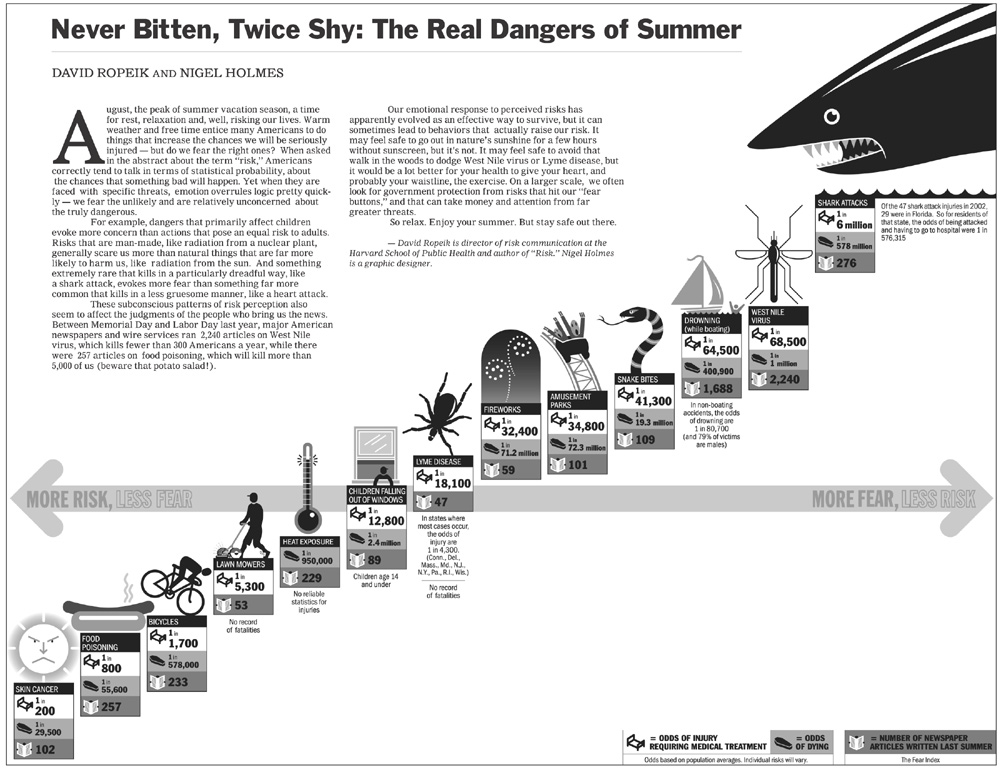
| 16:36, 5 November 2005 | Ropeik03neverbitten.jpg (file) |  |
190 KB | UE-InfoVis0506 0125116 (talk | contribs) | Never Bitten, Twice Shy: The Real Dangers Of Summer | 3 |
| 11:30, 4 November 2005 | Graphic.png (file) |  |
39 KB | UE-InfoVis0506 0125116 (talk | contribs) | Never Bitten, Twice Shy: The Real Danger of Summer (modified) | 1 |
| 11:29, 4 November 2005 | Newgraphic.png (file) |  |
39 KB | UE-InfoVis0506 0125116 (talk | contribs) | Never Bitten, Twice Shy: The Real Dangers of Summer (modified) | 2 |
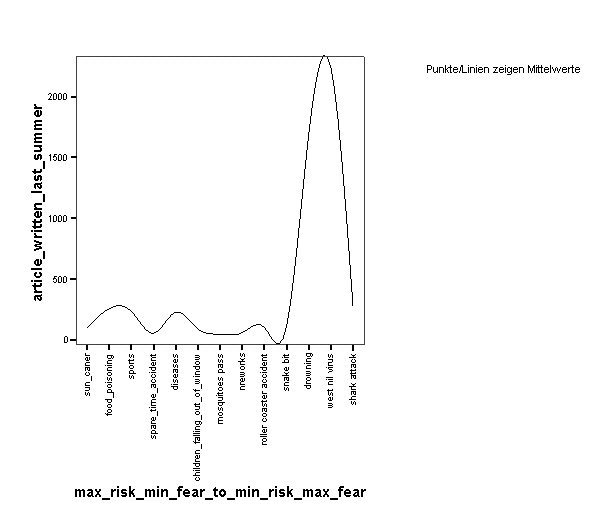
| 01:35, 4 November 2005 | Articel.JPG (file) |  |
48 KB | UE-InfoVis0506 0125116 (talk | contribs) | The image shows a written articel view. | 1 |
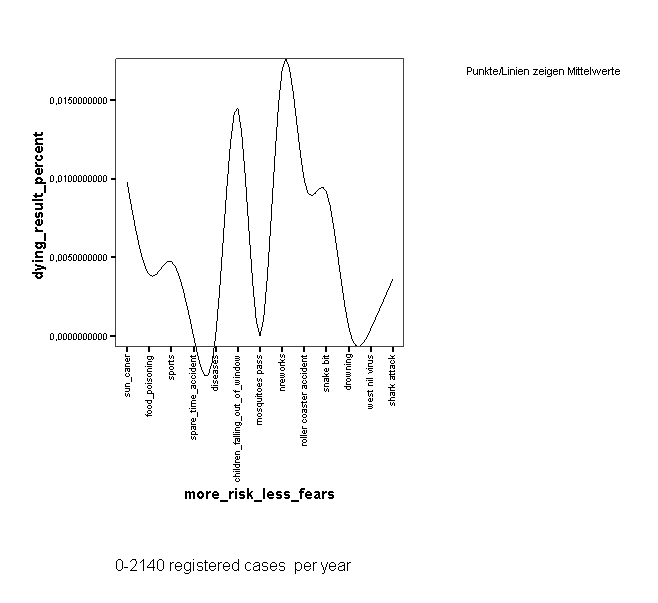
| 01:32, 4 November 2005 | Dying.JPG (file) |  |
58 KB | UE-InfoVis0506 0125116 (talk | contribs) | The image shows a dying cases view. | 1 |
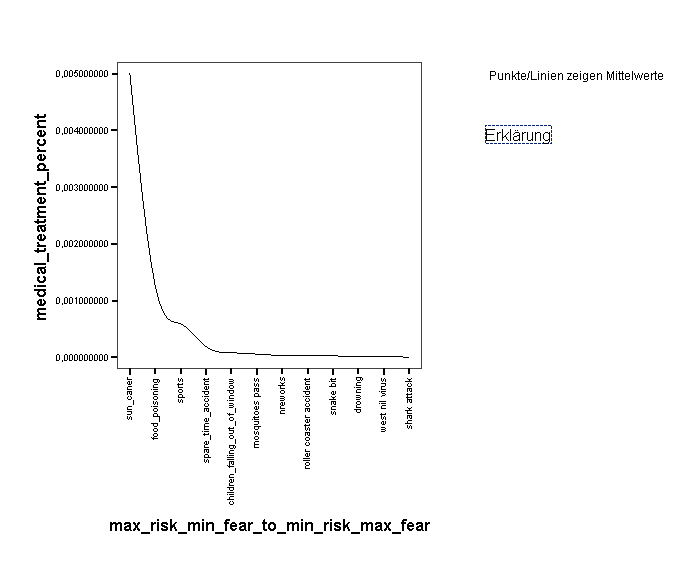
| 01:32, 4 November 2005 | Medical.JPG (file) |  |
54 KB | UE-InfoVis0506 0125116 (talk | contribs) | The image shows a required medical treatment view. | 2 |
| 21:37, 3 November 2005 | Occam 4.jpg (file) |  |
32 KB | UE-InfoVis0506 9335259 (talk | contribs) | 3 possible data sets. | 1 |
| 20:50, 3 November 2005 | Hoffig4b.gif (file) |  |
2 KB | UE-InfoVis0506 9335259 (talk | contribs) | 1 | |
| 20:50, 3 November 2005 | Hoffig4a.gif (file) |  |
2 KB | UE-InfoVis0506 9335259 (talk | contribs) | 1 | |
| 20:50, 3 November 2005 | Hoffig3.gif (file) |  |
1 KB | UE-InfoVis0506 9335259 (talk | contribs) | 1 | |
| 17:43, 3 November 2005 | 100 0034.JPG (file) |  |
36 KB | UE-InfoVis0506 9825503 (talk | contribs) | 1 | |
| 17:42, 3 November 2005 | 100 0033.JPG (file) |  |
37 KB | UE-InfoVis0506 9825503 (talk | contribs) | 1 | |
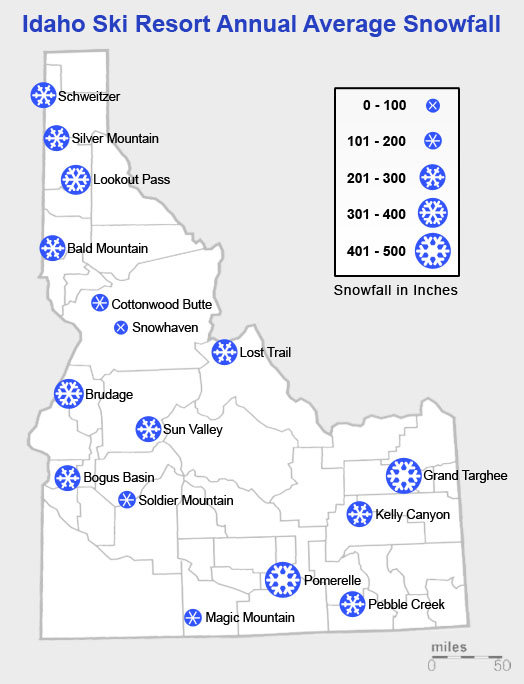
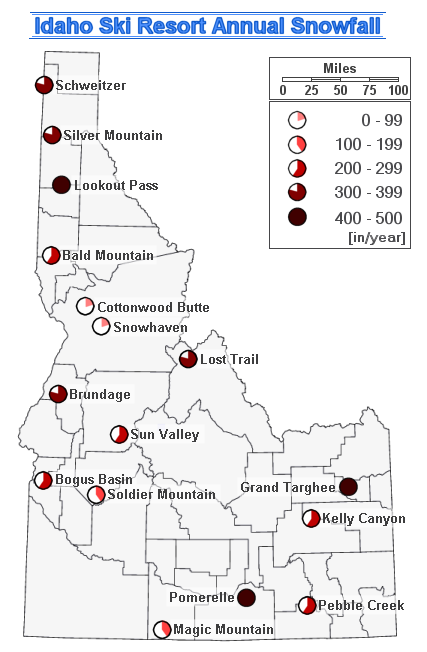
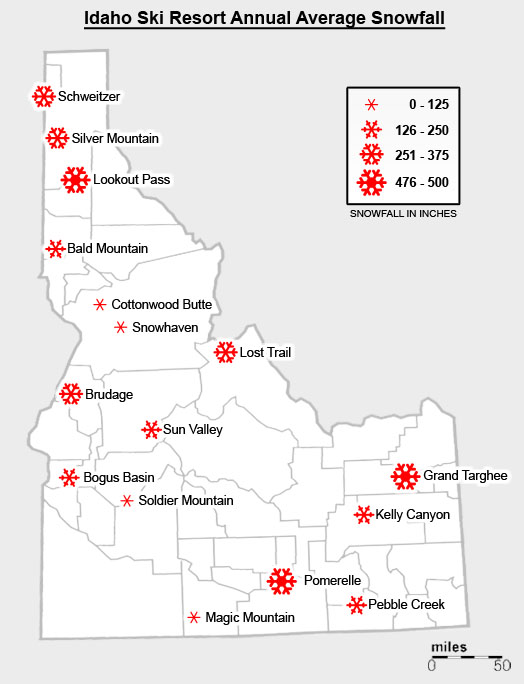
| 14:42, 3 November 2005 | SnowfallIdaho7.jpg (file) |  |
98 KB | UE-InfoVis0506 0306110 (talk | contribs) | Corrected Graphic fo the average annual snowfall in Idaho according to design principles. | 1 |
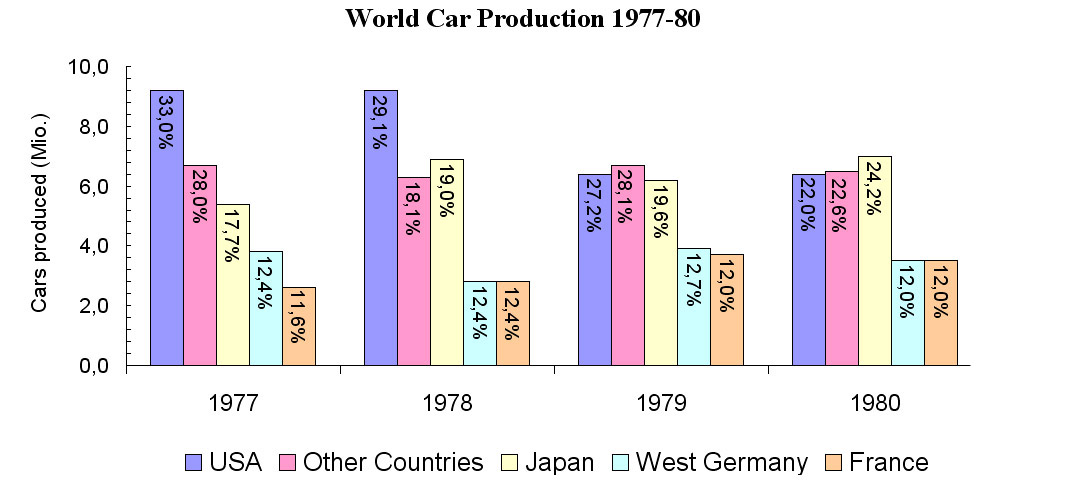
| 10:47, 3 November 2005 | Worldcarprod.jpg (file) |  |
105 KB | UE-InfoVis0506 0125718 (talk | contribs) | World Car Production 1977-80 | 5 |
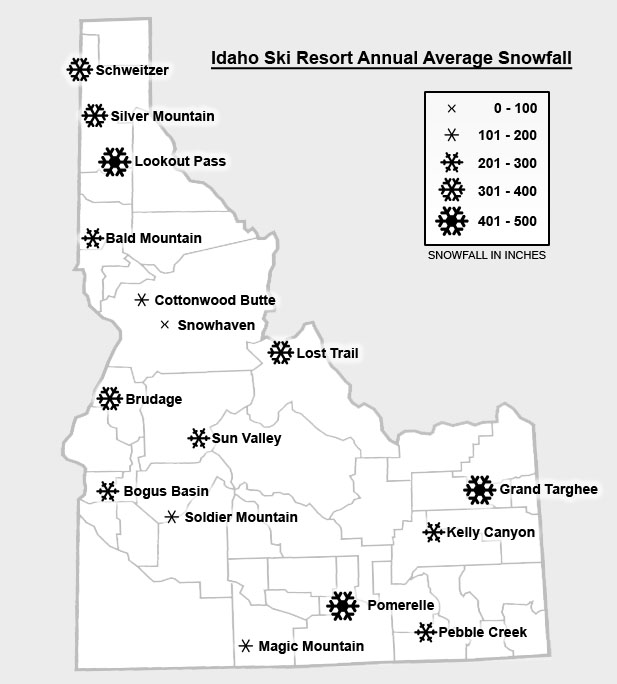
| 21:40, 1 November 2005 | Idaho Snowfall.png (file) |  |
78 KB | UE-InfoVis0506 0325693 (talk | contribs) | 9 | |
| 20:51, 1 November 2005 | Slicer Dicer Var1.gif (file) |  |
23 KB | UE-InfoVis0506 0026754 (talk | contribs) | Redesigned graph for exercise 2 - variant 1 | 3 |
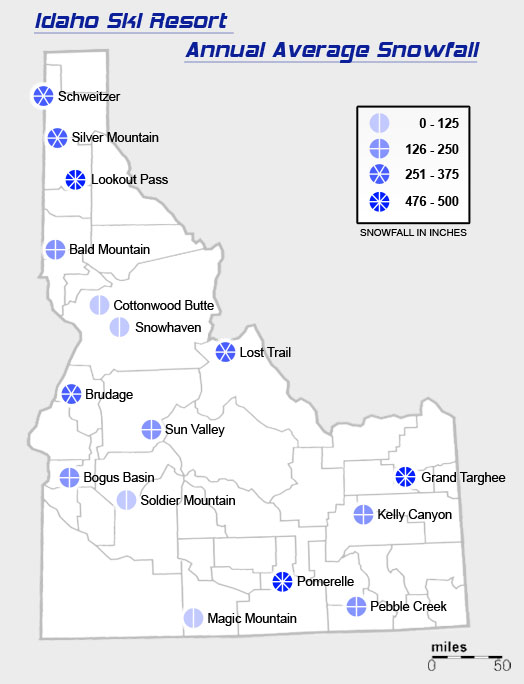
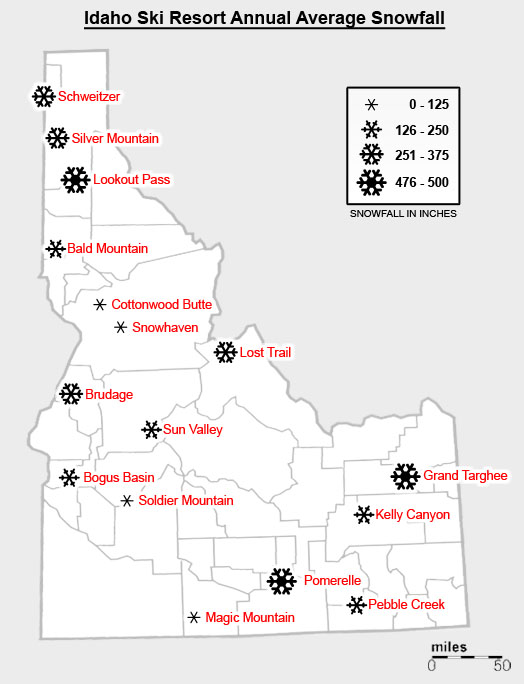
| 20:03, 1 November 2005 | SnowfallIdaho6.jpg (file) |  |
89 KB | UE-InfoVis0506 0306110 (talk | contribs) | 1 | |
| 20:02, 1 November 2005 | Slicer Dicer Var2.gif (file) |  |
26 KB | UE-InfoVis0506 0026754 (talk | contribs) | Redesigned graph for exercise 2 - variant 2 | 1 |
| 19:46, 1 November 2005 | SnowfallIdaho5.jpg (file) |  |
90 KB | UE-InfoVis0506 0306110 (talk | contribs) | 1 | |
| 19:43, 1 November 2005 | SnowfallIdaho4.jpg (file) |  |
94 KB | UE-InfoVis0506 0306110 (talk | contribs) | 1 | |
| 17:47, 1 November 2005 | 0225061 01 Screen3.jpg (file) |  |
103 KB | UE-InfoVis0506 0225061 (talk | contribs) | Screenshot of the GMX.at start page | 1 |
| 17:45, 1 November 2005 | Image1.jpg (file) |  |
103 KB | UE-InfoVis0506 0225061 (talk | contribs) | Screenshot of the GMX.at start page | 1 |
| 11:56, 1 November 2005 | SnowfallIdaho3.jpg (file) |  |
93 KB | UE-InfoVis0506 0306110 (talk | contribs) | 2 | |
| 15:59, 30 October 2005 | Junk01.gif (file) |  |
10 KB | UE-InfoVis0506 0227022 (talk | contribs) | 1 | |
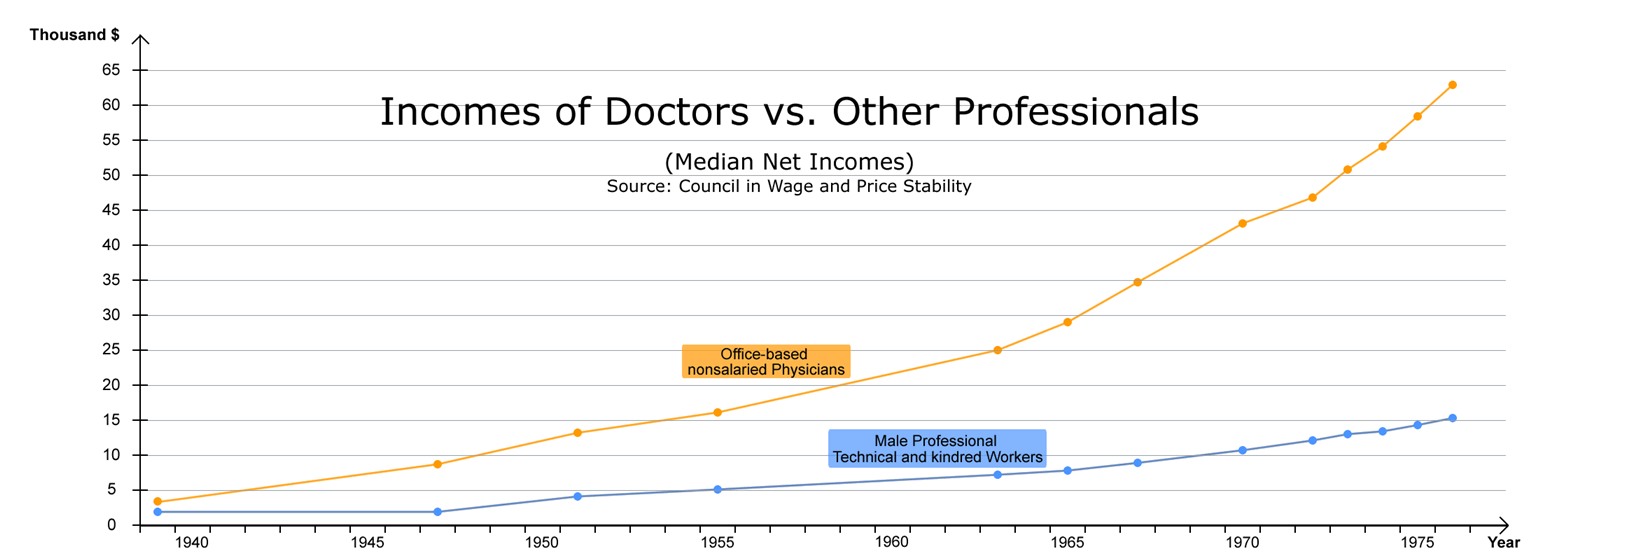
| 14:50, 29 October 2005 | Diagramm 01.png (file) |  |
48 KB | UE-InfoVis0506 0025470 (talk | contribs) | Better Diagramm of Doctors vs. other Professionals Income. | 1 |
| 19:38, 28 October 2005 | Proportion.gif (file) |  |
11 KB | UE-InfoVis0506 0306110 (talk | contribs) | Giving an easy example why the actually visible areas in a 3D bar chart are not proportional to the represented values. | 1 |
| 18:40, 28 October 2005 | Junk1.gif (file) |  |
9 KB | UE-InfoVis0506 0306110 (talk | contribs) | A foil out of a presentatioin by MAGGIE ELGIN, Ph.D from the University of Maryland. | 1 |
| 20:05, 27 October 2005 | Idaho04.gif (file) |  |
36 KB | UE-InfoVis0506 0227022 (talk | contribs) | 1 | |
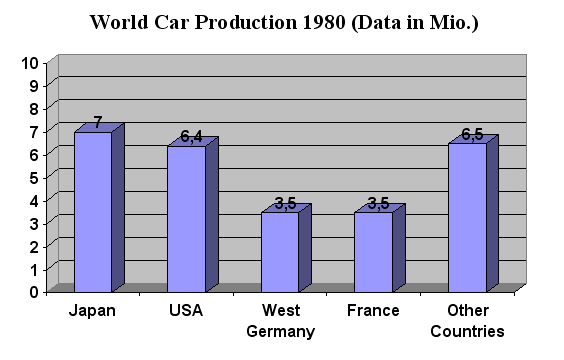
| 09:02, 27 October 2005 | Carprod80.jpg (file) |  |
89 KB | UE-InfoVis0506 0125718 (talk | contribs) | World Car Production 1980 | 1 |
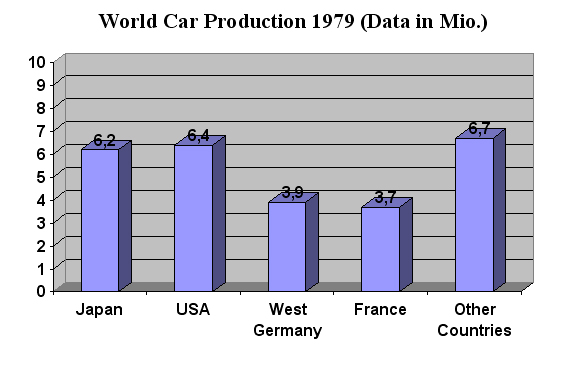
| 09:02, 27 October 2005 | Carprod79.jpg (file) |  |
92 KB | UE-InfoVis0506 0125718 (talk | contribs) | World Car Production 1979 | 1 |
| 09:01, 27 October 2005 | Carprod78.jpg (file) |  |
92 KB | UE-InfoVis0506 0125718 (talk | contribs) | World Car Production 1978 | 1 |