Explode to Explain: Difference between revisions
No edit summary |
No edit summary |
||
| Line 46: | Line 46: | ||
== Important Citations == | == Important Citations == | ||
{{Quotation|..we want to support the application of complex | {{Quotation|...we want to support the application of complex | ||
techniques by explaining them. For this reason, we | techniques by explaining them. For this reason, we | ||
concentrate on presentation rather than exploration and suggest | concentrate on presentation rather than exploration and suggest | ||
Revision as of 17:56, 7 May 2008
Authors
Short description
The basic problem behind this technique is, the complexity and sophistication of visualization techniques used to visualize constantly growing large data volumes and complex interrelationships. Traditional and easily self-explanatory techniques are not appropriate to visualize more complex interrelationships. On the other hand more complex visualization techniques are often very hard to understand for non expert people.
Exploded views are used widely in for example technical drawings. The idea is to show all details of a complicated construction by exploding the components and then showing the relationships of the components. Luboschik and Schumann (2007) propose the use of explosion for explaining the more complex information visualization technologies.
The explosition of basic visualization can be summarized in four steps.
1. Select a region of interest in the visual representation that will be used as akey element to explain the technique.
2. Generate an appropiate explosion scheme based on the underlying techniques.
3. Explode in comprehensive way.
4. Superimpose explanatory elements.
So the explosion is used to represent the visualization techniques in a way that non-expert people can also understand the techniques easily. The example techniques for this are pixelmaps (Figure 1.) and treemaps (Figure 2.). However the same idea can be used to generate enhanced views af data (Figure 3.).
Figures

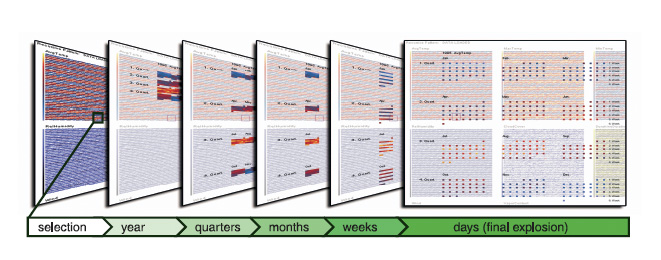
Figure 1. Exploded view of stepwise separation of recursion pattern.
In Figure 1. is explained the recursive pattern technique by using the explosion. All the steps of separation are shown from left to right and additional annotations are added to explain the semantic of recursion. One recursive pattern represents the data of one year, that is separated into its quarters, months and so on.

Figure 2. Exploded explanation of a treemap
Treemap is exploded to a serie of pictures. It shows the view-dependent explosion intodepth and the superimposing of underlying hierarchy. This kind of ilustration is applicable to most implicit 2D-techniques.

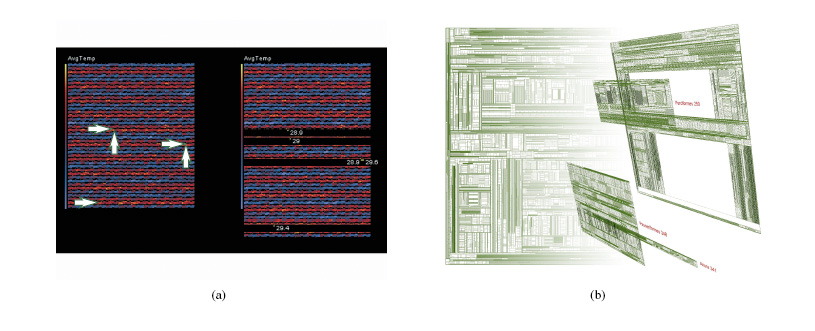
Figure 3. Highlighting the important data items by adding exploded view to a) recursive pattern technique, b) treemap
In recursive pattern the five highest values are pointed by arrows (left) and the data of those points is shown in right (Figure 3. (a)). In treemap the three most complex biological orders within the phylum of vertebrates are accentuated and labeled with their Latin name and their complexity value (Horton-Strahler number) (Figure 3. (b)).
Suitable Datatypes
Basically all kind of data presented in 2D- form can be illustrated.
Important Citations
techniques by explaining them. For this reason, we concentrate on presentation rather than exploration and suggest a temporal adaptation of visual representations by an explosion and the integration of explanatory elements: we propose the illustration of images gained from information
visualization.
Evaluation
Internal Links
External Links
References
Luboschik M. & Schumann H. 2004. Explode to Explain – Illustrative Information Visualization, Institute of Computer Science, University of Rostock, D-18051 Rostock, Germany, 11th International Conference Information Visualization