CourseVis: Difference between revisions
m Reverted edit of MmwNof, changed back to last version by UE-InfoVis07-11 |
mNo edit summary |
||
| Line 31: | Line 31: | ||
== Evaluation == | == Evaluation == | ||
[Mazza, 2006] | for [Mazza, 2006] see also [[Evaluating_Information_Visualization_Applications]] | ||
== References == | == References == | ||
Latest revision as of 14:40, 17 July 2007
Authors
Short Description
Suitable Datatypes
This method can be used for tracking data generated by course management systems (CMS). Currently, the only supported CMS is WebCT.
Figures
Social Aspects:
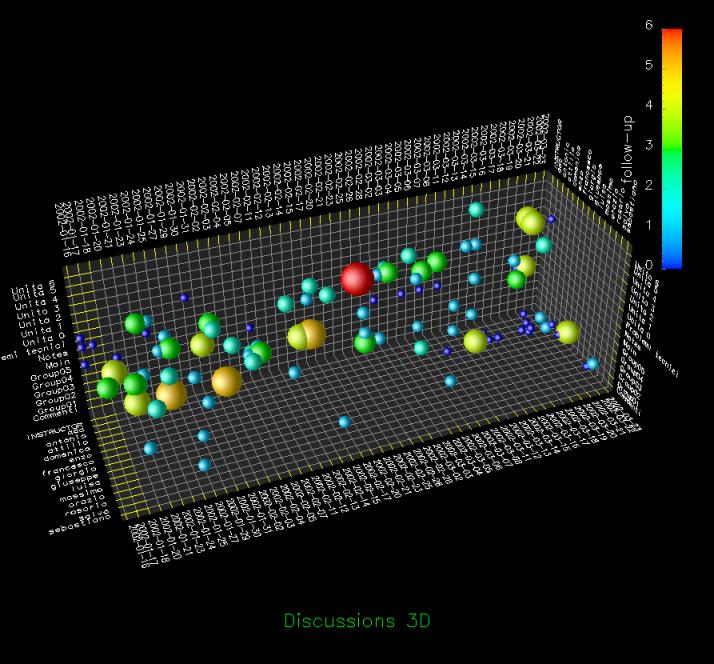
This plot is a representation of the students' social activities (i.e. in a discussion board); It allows different views on aspects like date, student or topic. The size of the point describes the intensity and the color the activity a student did (red for start a topic, green for an answer and blue for reading).

Cognitive Aspects:
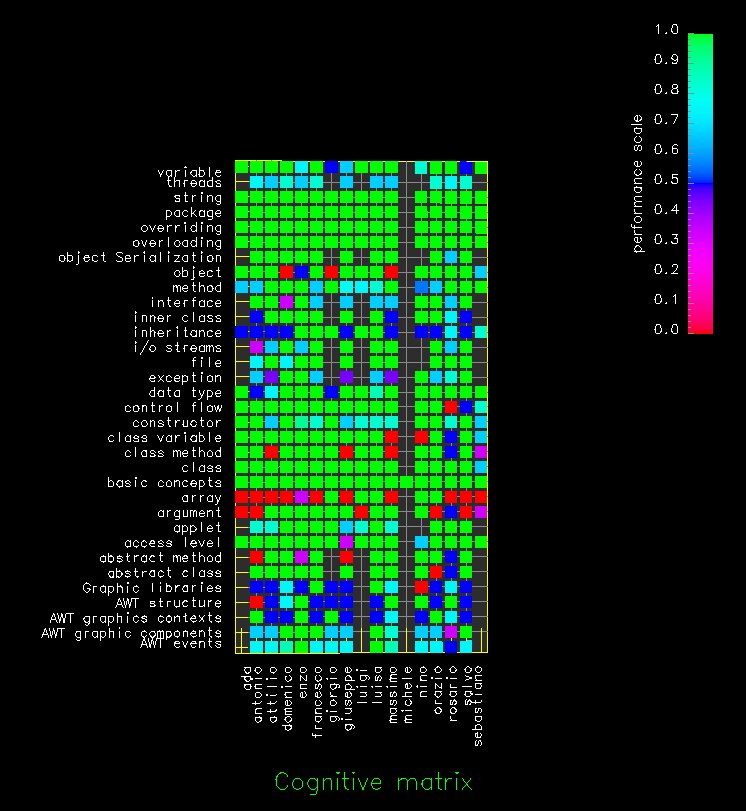
Its a representation for the cognitive level for each student. The representation is shown in a matrix. On the x-axis of the matrix are the students and on the y-axis the concept. The color of the points shows the performance.

Behavioural Aspects:
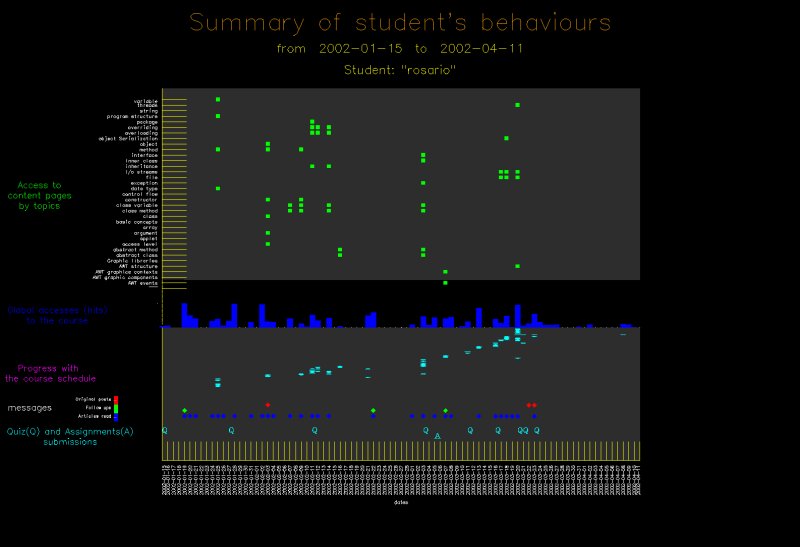
This graph is a representation of a students overall performance. It shows his/her accesses to the content, the global accesses, the progress with the course, messages at the discussion board and submissions to quizes and assignments.

Evaluation
for [Mazza, 2006] see also Evaluating_Information_Visualization_Applications
References
[Mazza and Dimitrova, 2004] Mazza, Ricardo; Dimitrova, Vania. Visualising student tracking data to support instructors in web-based distance education. In Proceedings of the 13th international World Wide Web conference on Alternate track papers & posters, pp. 154-161. 2004.
Evaluation References
[Mazza, 2006] Mazza, Ricardo. Evaluating information visualization applications with focus groups: the CourseVis experience. In Proceedings of the 2006 AVI Workshop on Beyond Time and Errors: Novel Evaluation Methods For information Visualization, pp. 1-6, 2006.