Teaching:TUW - UE InfoVis WS 2008/09 - Gruppe 03 - Aufgabe 1 - Chernoff Face: Difference between revisions
No edit summary |
No edit summary |
||
| Line 5: | Line 5: | ||
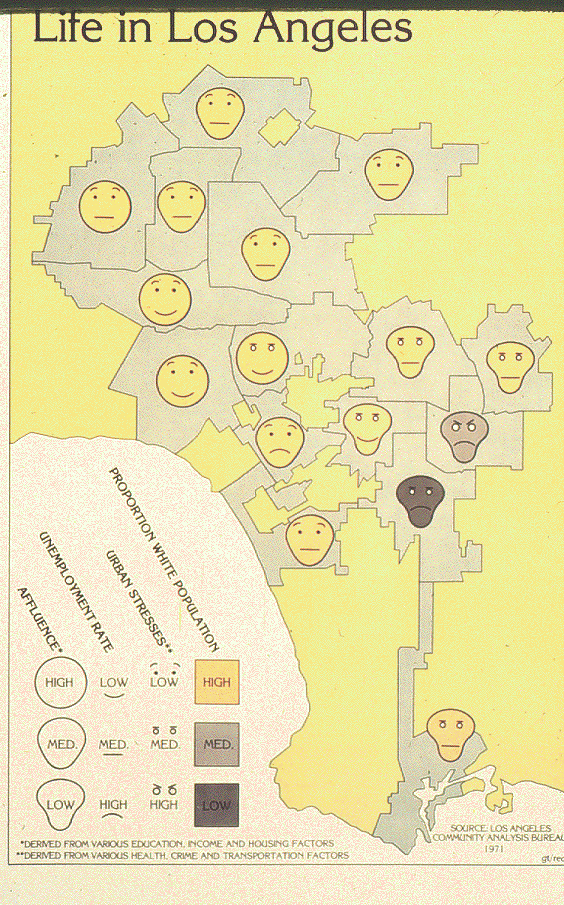
[[Image:lifeinla.GIF|thumb|none|right|150px|Fig. 1: Life in Los Angeles <br> [Turner, 1977]]] | [[Image:lifeinla.GIF|thumb|none|right|150px|Fig. 1: Life in Los Angeles <br> [Turner, 1977]]] | ||
{{Quotation| | {{Quotation| These faces are a type of [[Glyph|glyph]], a graphical object whose properties represent data values. |[Kosara, 2007]}} | ||
The idea of displaying faces to represent multivariate data was first published in 1973 in The Journal of American National Statistic by Herman Chernoff who was born in 1923 in America. | The idea of displaying faces to represent multivariate data was first published in 1973 in The Journal of American National Statistic by Herman Chernoff who was born in 1923 in America. | ||
| Line 27: | Line 27: | ||
* [Spinelli and Zhou, 2004] Joseph G. Spinelli and Yu Zhou. "Mapping Quality of Life with Chernoff Faces", ''4th Annual ESRI Education User Conference 2004'', San Diego, CA, August 2004.http://downloads2.esri.com/campus/uploads/library/pdfs/58415.pdf | * [Spinelli and Zhou, 2004] Joseph G. Spinelli and Yu Zhou. "Mapping Quality of Life with Chernoff Faces", ''4th Annual ESRI Education User Conference 2004'', San Diego, CA, August 2004.http://downloads2.esri.com/campus/uploads/library/pdfs/58415.pdf | ||
* [Morris et al., 2000] Christopher J. Morris, David S. Ebert, Penny Rheingans. An Experimental Analysis of the Effectiveness of Features in Chernoff Faces. ''28th AIPR Workshop: 3D Visualization for Data Exploration and Decision Making, Proceedings of SPIE'', pages 12- 17, 2000. http://www.csee.umbc.edu/~ebert/papers/Chernoff_990402.PDF | * [Morris et al., 2000] Christopher J. Morris, David S. Ebert, Penny Rheingans. An Experimental Analysis of the Effectiveness of Features in Chernoff Faces. ''28th AIPR Workshop: 3D Visualization for Data Exploration and Decision Making, Proceedings of SPIE'', pages 12- 17, 2000. http://www.csee.umbc.edu/~ebert/papers/Chernoff_990402.PDF | ||
* [Kosara, 2007] Robert Kosara. A Critique of Chernoff Faces. Created at: February 25, 2007. Retrieved at: | * [Kosara, 2007] Robert Kosara. A Critique of Chernoff Faces. Created at: February 25, 2007. Retrieved at: November 4, 2009. http://eagereyes.org/VisCrit/ChernoffFaces.html | ||
Revision as of 16:46, 4 November 2009
Introduction
This means that instead of using a vector representation for describing sets of data, a vector is represented by a face that can hold up to 18 dimensions. Changes of vectors result in different faces, which the human brain can treat better than vectors. Chernoff faces therefore are often used in statistic presentations as Figure 1 shows.

[Turner, 1977]
The idea of displaying faces to represent multivariate data was first published in 1973 in The Journal of American National Statistic by Herman Chernoff who was born in 1923 in America.
The idea in detail
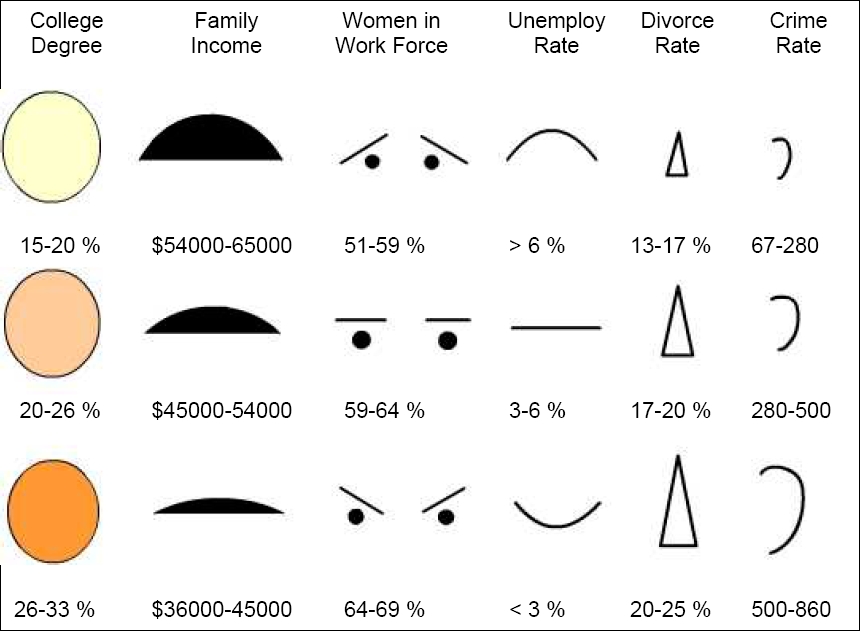
As already said Chernoff faces are simplified faces that can help viewers to detect patterns, groupings, and correlation. Having data sets each dimension is assigned to a facial characteristic. Facial characteristics are for example eyebrow slant, eye spacing, head eccentricity, pupil size, and so on. Inside the data set each dimension represents a feature which can be classified. If we say for example that one feature of our face displays the rate of unemployment (rate) we could classify that rate into three classes e.g. rate < 3%, 3% < rate < 6% or rate > 6%. So we have three classes for the feature rate of unemployment. As each feature describes a characteristic of a face we could say that the shape of the mouth could stand for the rate of unemployment as figure 2 demonstrates.

[Spinelli and Zhou, 2004]
Hence, every face unambiguously describes one feature vector, which in turn combines several features to describe one condition, like the quality of life as in [Spinelli and Zhou, 2004].
Critics
Chernoff faces may be not that effective it seems. Certain features like the perception of eye size, eyebrow slant and the combination of those both are more influencing for longer viewing times than others. Therefore [Morris et. al, 2000] came to the conclusion that the use of Chernoff faces "may not have a significant advantage over other iconic visualization techniques for multidimensional information visualization.”
References
- [Wikipedia, 2009] Wikipedia contributors. Chernoff_face. Wikipedia, the free encyclopedia. Last modified on October 8, 2009, at 17:34. Retrieved at: November 4, 2009. http://en.wikipedia.org/wiki/Chernoff_face
- [Turner, 1977] Eugene Turner, Life in LA, 1977 Retrieved at: November 7, 2008. http://www.csun.edu/%7Ehfgeg005/eturner/gallery/
- [Chernoff, 1973] Herman Chernoff. The Use of Faces to Represent Points in k-Dimensional Space Graphically, Journal of the American Statistical Association, 68 (#342): 361-368, 1973. http://www.jstor.org/pss/2284077
- [Spinelli and Zhou, 2004] Joseph G. Spinelli and Yu Zhou. "Mapping Quality of Life with Chernoff Faces", 4th Annual ESRI Education User Conference 2004, San Diego, CA, August 2004.http://downloads2.esri.com/campus/uploads/library/pdfs/58415.pdf
- [Morris et al., 2000] Christopher J. Morris, David S. Ebert, Penny Rheingans. An Experimental Analysis of the Effectiveness of Features in Chernoff Faces. 28th AIPR Workshop: 3D Visualization for Data Exploration and Decision Making, Proceedings of SPIE, pages 12- 17, 2000. http://www.csee.umbc.edu/~ebert/papers/Chernoff_990402.PDF
- [Kosara, 2007] Robert Kosara. A Critique of Chernoff Faces. Created at: February 25, 2007. Retrieved at: November 4, 2009. http://eagereyes.org/VisCrit/ChernoffFaces.html