Exploring Video Streams using Slit-Tear Visualizations: Difference between revisions
No edit summary |
No edit summary |
||
| Line 13: | Line 13: | ||
== Figures == | == Figures == | ||
'''Pattern-level analysis | '''Pattern-level analysis''' | ||
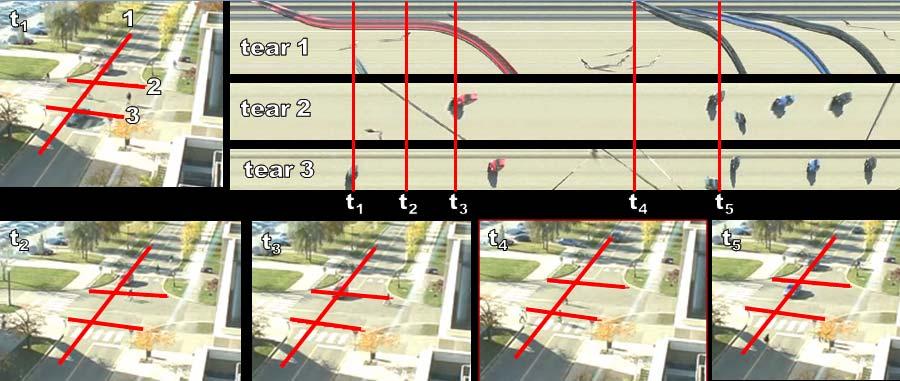
This image shows how events can be visualized spatially which allows for a discovery of patterns and for an effective correlation of events. Frames t1 to t5 capture a traffic intersection at particular moments in time according to the three slits, drawn by the observer. The interaction of cars and pedestrians is visualized by setting up a timeline for each pre-defined slit where the movement of the objects is depicted by strokes of different length, based on their orientation to each slit. | This image shows how events can be visualized spatially which allows for a discovery of patterns and for an effective correlation of events. Frames t1 to t5 capture a traffic intersection at particular moments in time according to the three slits, drawn by the observer. The interaction of cars and pedestrians is visualized by setting up a timeline for each pre-defined slit where the movement of the objects is depicted by strokes of different length, based on their orientation to each slit. | ||
[[Image:Intersection.jpeg|thumb|Traffic intersection]] | [[Image:Intersection.jpeg|thumb|Traffic intersection]]<br> | ||
== Important citations == | == Important citations == | ||
Revision as of 13:18, 25 May 2009
Authors
Short description
Suitable Datatypes
This method can be applied to live video as well as captured AVI files where each frame is either computed seperately or completely in advance, together with its successors. The latter is only relevant to non-live video.
Figures
Pattern-level analysis This image shows how events can be visualized spatially which allows for a discovery of patterns and for an effective correlation of events. Frames t1 to t5 capture a traffic intersection at particular moments in time according to the three slits, drawn by the observer. The interaction of cars and pedestrians is visualized by setting up a timeline for each pre-defined slit where the movement of the objects is depicted by strokes of different length, based on their orientation to each slit.

Important citations
Evaluation
As per May 2009, there are no evaluations of slit-tear visualizations. Hence, an evaluation of the effectiveness of this tool for novice users in realistic tasks is planned for the near future.
References
[Tang et al., 2008] Anthony Tang, Saul Greenberg and Sidney Fels, 2008. Exploring Video Streams using Slit-Tear Visualizations. In Proceedings of the working conference on Advanced Visual Interfaces (AVI 2008). (May 28-30, Napoli, Italy). ACM Press. pp: 191-198.