File:Treemaps fig1.jpg: Difference between revisions
Jump to navigation
Jump to search
different visualizations of trees |
mNo edit summary |
||
| (One intermediate revision by the same user not shown) | |||
| Line 1: | Line 1: | ||
== Summary == | == Summary == | ||
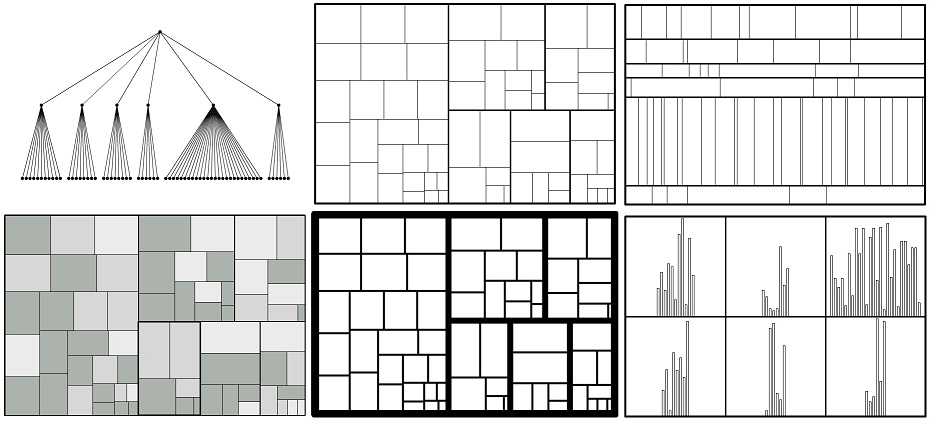
different visualizations of | different visualizations of hierarchical data. | ||
The tree (1st row 1st figure) is visualized with treemaps with varying aspect ratio (1st row, 1st and 2nd image), varying luminance (2nd row 1st image), varying border thickness (2nd row 2nd image) or with hierarchical bar charts (2nd row 3rd image). | |||
== Copyright status == | == Copyright status == | ||
== Source == | == Source == | ||
Nicholas Kong, Jeffrey Heer, Maneesh Agrawala. Perceptual Guidelines for Creating Rectangular Treemaps. ''IEEE Transactions on Visualization and computer Graphics'', 16(6):990-998, November/December 2010. | |||
Latest revision as of 17:22, 15 November 2010
Summary
different visualizations of hierarchical data. The tree (1st row 1st figure) is visualized with treemaps with varying aspect ratio (1st row, 1st and 2nd image), varying luminance (2nd row 1st image), varying border thickness (2nd row 2nd image) or with hierarchical bar charts (2nd row 3rd image).
Copyright status
Source
Nicholas Kong, Jeffrey Heer, Maneesh Agrawala. Perceptual Guidelines for Creating Rectangular Treemaps. IEEE Transactions on Visualization and computer Graphics, 16(6):990-998, November/December 2010.
File history
Click on a date/time to view the file as it appeared at that time.
| Date/Time | Thumbnail | Dimensions | User | Comment | |
|---|---|---|---|---|---|
| current | 17:00, 15 November 2010 |  | 929 × 421 (91 KB) | UE-InfoVis1011 0927624 (talk | contribs) | different visualizations of trees |
You cannot overwrite this file.
File usage
The following page uses this file: