Evaluating Information Visualization Applications: Difference between revisions
m url internal |
|||
| (14 intermediate revisions by 3 users not shown) | |||
| Line 3: | Line 3: | ||
== Author == | == Author == | ||
[ | [[Mazza%2C_Riccardo|Riccardo Mazza]] | ||
== Short Description == | == Short Description == | ||
{{Quotation|Evaluation of user-centred tools often makes use of analytic and empirical techniques with the objective to investigate the usability, the functionality, and the effectiveness of an interactive system.| [Dix, Finley, Abowd, Beale, 1998]}}<br/> | |||
There are two different types of "Human Computer Interacion Evaluation Methods":<br/> | |||
*Analytic Methods | |||
*Empiric Methods | |||
**Quantitave Studies | |||
**Qualitative Studies | |||
== CourseVis == | == CourseVis == | ||
| Line 42: | Line 49: | ||
* Semi-structured Interview | * Semi-structured Interview | ||
<br />{{Quotation|The focus group and the semi-structured interview aimed to assess the usefulness of the graphical representations generated in CourseVis, while the experimental study aimed at verifying the effectiveness and the efficiency of the representations.| [R. Mazza, 2006]}} | |||
== Important Citation == | == Important Citation == | ||
| Line 51: | Line 60: | ||
{{Quotation| formulate and answer questions [users] didn’t anticipate having | {{Quotation| formulate and answer questions [users] didn’t anticipate having | ||
before looking at the visualization| [C. Plaisant, 2004]}} | before looking at the visualization| [C. Plaisant, 2004]}} | ||
== References == | |||
*[[CourseVis|CourseVis]] | |||
*[Mazza and Dimitrova, 2004] Mazza, Ricardo; Dimitrova, Vania. [http://doi.acm.org/10.1145/1013367.1013393 Visualising student tracking data to support instructors in web-based distance education.] In ''Proceedings of the 13th international World Wide Web conference on Alternate track papers & posters'', pp. 154-161. 2004. | |||
*[Mazza, 2006] Mazza, Ricardo. [http://doi.acm.org/10.1145/1168149.1168155 Evaluating information visualization applications with focus groups: the CourseVis experience.] In ''Proceedings of the 2006 AVI Workshop on Beyond Time and Errors: Novel Evaluation Methods For information Visualization'', pp. 1-6, 2006. | |||
Latest revision as of 14:32, 17 July 2007
Author
Short Description
There are two different types of "Human Computer Interacion Evaluation Methods":
- Analytic Methods
- Empiric Methods
- Quantitave Studies
- Qualitative Studies
CourseVis
Figures
The following visualizations are used to represent the collected data from CourseVis:
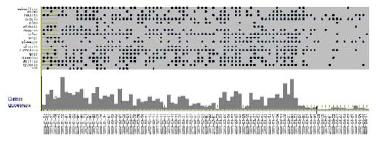
- Access Plot:
The access plot shows the students' accesses to the course. It is an mixture of a scatterplot and a histogram.
The scatterplot shows the data of students and of the course while the histogram shows the number of pages of the course accessed by all students on a special date.

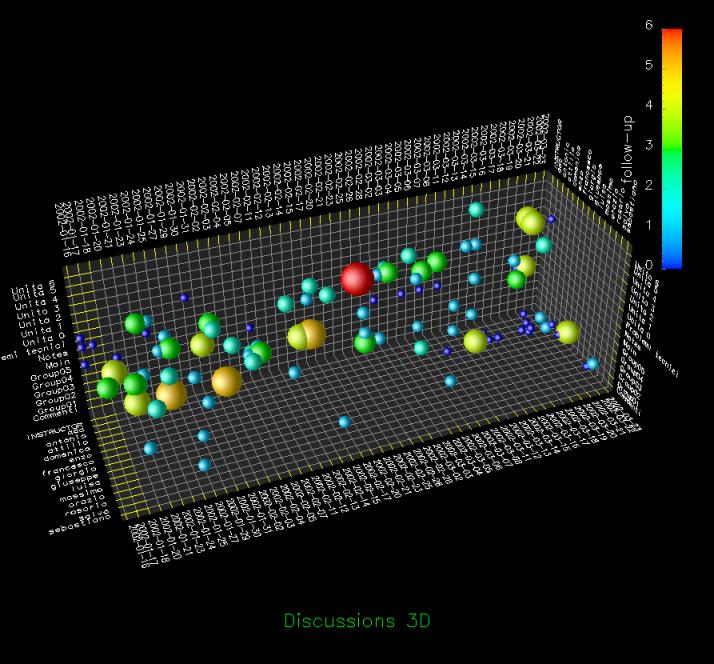
- Discussion Plot:
This 3D scatterplot is about the disussions of the course. The figure shows time, topics and students.
The sphere represents a new thread and the number of messages are encoded with the color and size of the sphere.

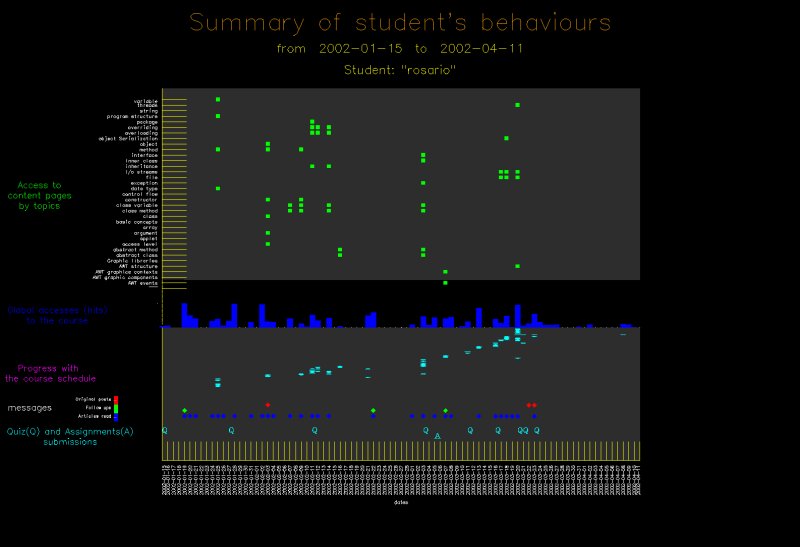
- Behavioural Graph:
This graph represents the behaviours of a single student.
It shows the student's access to the content pages, the global access to the course, a progress with the schedule of the course, messages and the submission of quizzes and assignments.

Evaluation Types
- Focus Group
- Controlled Experiment
- Semi-structured Interview
Important Citation
via the social gathering and the interaction which being in a focus
group entails
References
- CourseVis
- [Mazza and Dimitrova, 2004] Mazza, Ricardo; Dimitrova, Vania. Visualising student tracking data to support instructors in web-based distance education. In Proceedings of the 13th international World Wide Web conference on Alternate track papers & posters, pp. 154-161. 2004.
- [Mazza, 2006] Mazza, Ricardo. Evaluating information visualization applications with focus groups: the CourseVis experience. In Proceedings of the 2006 AVI Workshop on Beyond Time and Errors: Novel Evaluation Methods For information Visualization, pp. 1-6, 2006.