VisMT: Difference between revisions
No edit summary |
No edit summary |
||
| Line 5: | Line 5: | ||
== Description == | == Description == | ||
Retail space management is one of the more crucial challenges faced by retailers today with an ever expanding volume of data to which they must refer when making decisions. VisMT is a Visual Space Management System that explores retail data related to space performance. It | Retail space management is one of the more crucial challenges faced by retailers today with an ever expanding volume of data to which they must refer when making decisions. VisMT is a Visual Space Management System that explores retail data related to space performance. It is built from components of the "GeoAnalytics visualization (GAV) component toolkit" that provides a broad collection of visual interaction components from the InfoVis domain. It is a multiple linked-view application that integrates a 3D layout of stores with retail data sources. | ||
{{Quotation|We believe that this approach makes sense because around 80% of human decisions are spatialbased and it’s a familiar metaphor to access data.| [M. Jern, 2007]}} | |||
== GeoAnalytics visualization component toolkit (GAV) == | == GeoAnalytics visualization component toolkit (GAV) == | ||
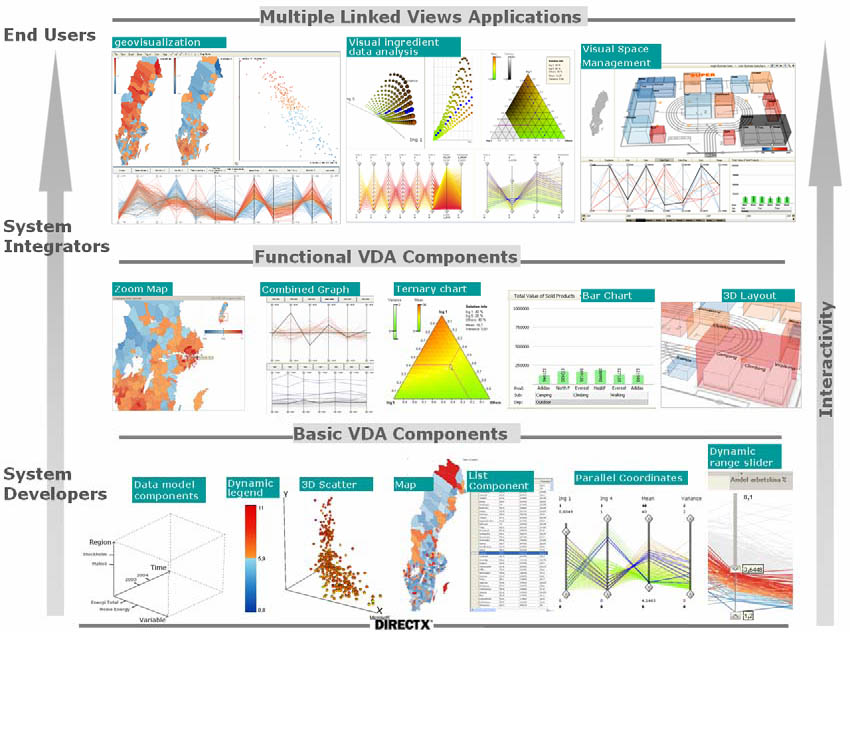
The GAV framework is a layered components architecture for Visual Data Analysis (VDA). There exist basic components (like 3D Scatter, Map, Parallel Coordinates, ...) that can be combined into Functional VDA Components like Zoom Maps, 3D Layout, Combined Graphs, ... that can then be combined into applications displaying data from different sources. | [[Image:jern_gav.jpg|right|thumb|300px|GAV framework, [Jern, 2007]]] | ||
The GAV framework is a layered components architecture for Visual Data Analysis (VDA). It is developed for the .NET framework and based on DirectX. There exist basic components (like 3D Scatter, Map, Parallel Coordinates, ...) that can be combined into Functional VDA Components like Zoom Maps, 3D Layout, Combined Graphs, ... that can then be combined into applications displaying data from different sources. | |||
{{Quotation|Interoperability is an idea that is invaluable to our development of the GAV toolkit.| [M. Jern, 2007]}} | |||
{{Quotation| | |||
== Data Types == | == Data Types == | ||
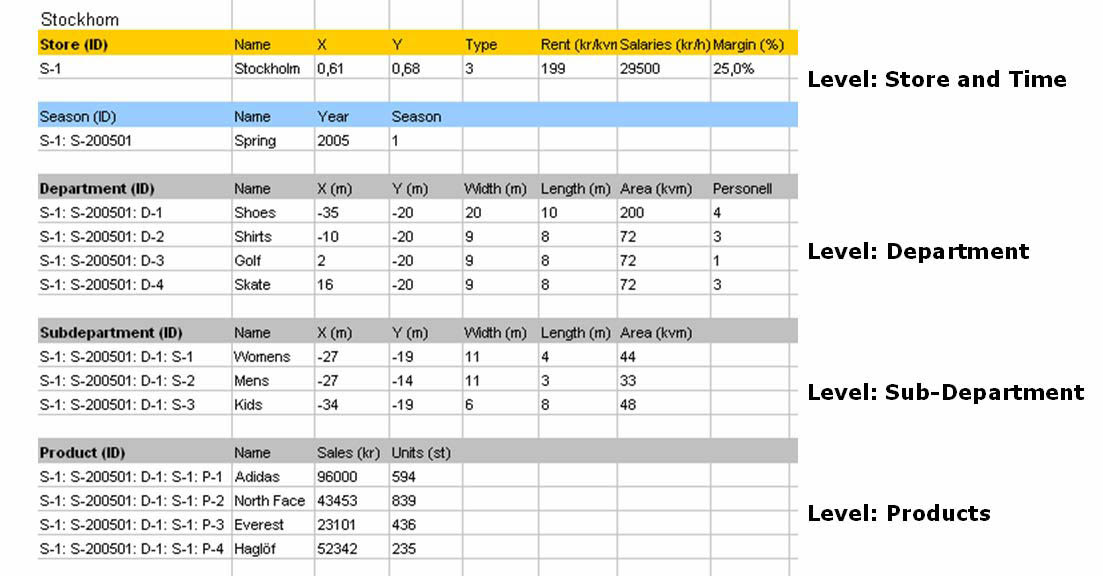
[[Image:data_structure.jpg|right|thumb|300px|Sample date Structure, [Jern, 2007]]] | |||
The VisMT application uses an object-oriented database with a hierarchical class structure. The retail data are defined in an Excel format and are converted to the hierarchical data structure. | The VisMT application uses an object-oriented database with a hierarchical class structure. The retail data are defined in an Excel format and are converted to the hierarchical data structure. | ||
The components of the GAV component theoretically can work with every kind of data as for every type components can be developed and linked with each other. | |||
{{Quotation|Retail data is abstract, complex and temporal, without a natural spatial dimension.| [M. Jern, 2007]}} | |||
== External Links == | == External Links == | ||
Latest revision as of 20:58, 8 May 2008
An Information Visualization Approach to Retail Space Management (VisMT) [Jern, 2007]
Author
Description
Retail space management is one of the more crucial challenges faced by retailers today with an ever expanding volume of data to which they must refer when making decisions. VisMT is a Visual Space Management System that explores retail data related to space performance. It is built from components of the "GeoAnalytics visualization (GAV) component toolkit" that provides a broad collection of visual interaction components from the InfoVis domain. It is a multiple linked-view application that integrates a 3D layout of stores with retail data sources.
GeoAnalytics visualization component toolkit (GAV)

The GAV framework is a layered components architecture for Visual Data Analysis (VDA). It is developed for the .NET framework and based on DirectX. There exist basic components (like 3D Scatter, Map, Parallel Coordinates, ...) that can be combined into Functional VDA Components like Zoom Maps, 3D Layout, Combined Graphs, ... that can then be combined into applications displaying data from different sources.
Data Types

The VisMT application uses an object-oriented database with a hierarchical class structure. The retail data are defined in an Excel format and are converted to the hierarchical data structure. The components of the GAV component theoretically can work with every kind of data as for every type components can be developed and linked with each other.
External Links
- VisMT demonstrator application
- SPACEMAN Suite - Shelf planning system by Nielsen Media Research
References
- [Jern, 2007] Jern Mikael, An Information Visualization Approach to Retail Space Management (VisMT). In Proceedings of the 11th International Conference Information Visualization, pages 109-116, 2007.
- [Hochheiser, 2004], Hochheiser H. and Shneiderman B., Dynamic query tools for time series data sets: Timebox widgets for interactive exploration, Information Visualization, Vol. 3, Issue 1, pages 1-18, 2004.