Teaching:TUW - UE InfoVis WS 2007/08 - Gruppe 03 - Aufgabe 1 - Volume Visualization: Difference between revisions
(New page: ==Overview of the Volume Visualization== Volume Visualization is the process of understanding multidimensional dataset by projecting it onto 2D images. Generally, the different Technique...) |
(No difference)
|
Revision as of 14:53, 9 November 2007
Overview of the Volume Visualization
Volume Visualization is the process of understanding multidimensional dataset by projecting it onto 2D images. Generally, the different Techniques of Volume Visualisation consist on projecting 3D dataset onto 2D images. Those techniques are used in many domains as medicine, geoscience, astrophysics, chemistry, microscopy, mechanical engineering, ...
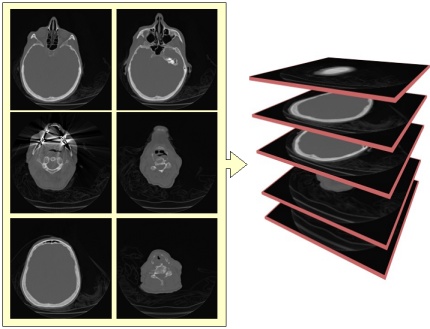
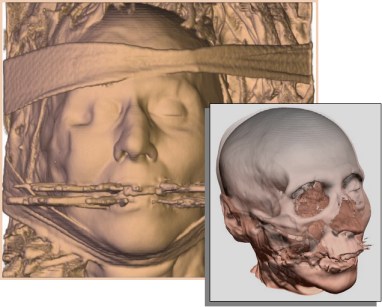
For example, with a CT scan, we obtain a lot of images which are layers of the head like on the first photo. After a prjoection, we can obtain different kind of images, depending on what we want to see. We can see two different way of the use of volume visualisation on the second photo.
There are differents algorithms for Volume Visualization, the basic steps for all of those algorithms are as follows :
  1. Data acquisition either via empirical measurement or computer simulation.
  2. Put the data into a format that can be easily manipulated.
  3. The data is mapped onto geometric or display primitives.
  4. The primitives are stored, manipulated, and displayed.

