Uploads by UE-InfoVis1011 0326062
Jump to navigation
Jump to search
This special page shows all uploaded files.
| Date | Name | Thumbnail | Size | Description | Versions |
|---|---|---|---|---|---|
| 09:51, 23 October 2010 | Ich.png (file) |  |
154 KB | Thomas Schneider, 2010 | 1 |
| 09:53, 23 October 2010 | Thomas Schneider.png (file) |  |
154 KB | Thomas Schneider, 2010 | 1 |
| 16:37, 17 January 2011 | Watervisbarchart.png (file) |  |
36 KB | The bar chart shows the improvement/decline of drinking water supply | 1 |
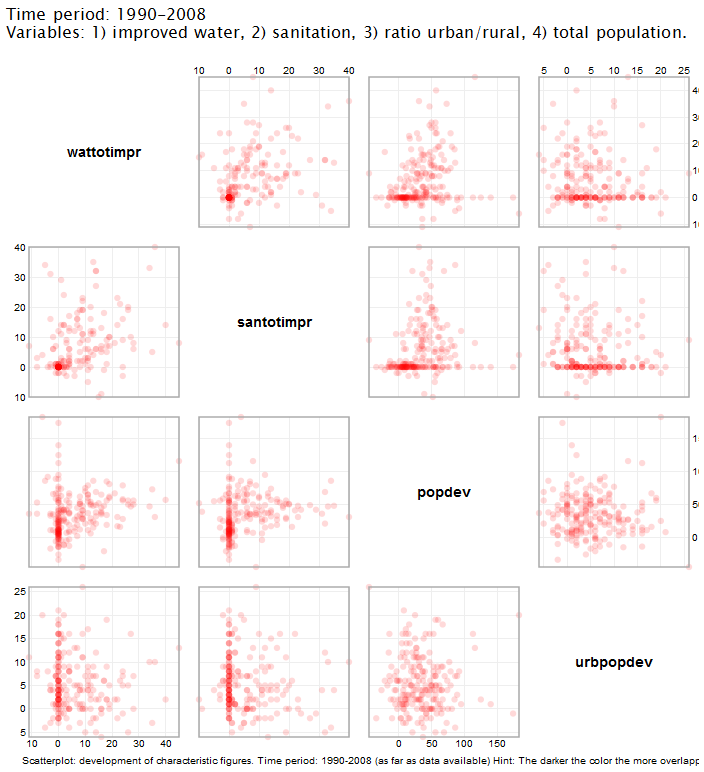
| 17:01, 17 January 2011 | ScatterplotKeyvariables.png (file) |  |
105 KB | The scatterplots show the change of monitored JMP-variables during the time 1990-2008. | 1 |