Uploads by InfoVis1011 9925916
Jump to navigation
Jump to search
This special page shows all uploaded files.
| Date | Name | Thumbnail | Size | Description | Versions |
|---|---|---|---|---|---|
| 20:58, 22 October 2010 | MKraxner.JPG (file) |  |
178 KB | Michael Kraxner, 2010 | 1 |
| 21:15, 16 November 2010 | Fig4-Rorschach.JPG (file) |  |
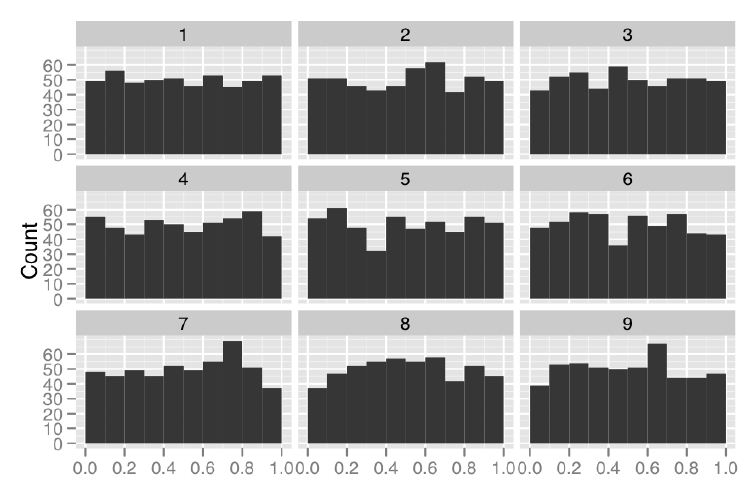
54 KB | Rorschach protocol: Nine histograms summarizing the accuracy at which 500 participants perform nine tasks. What do you see? | 1 |
| 21:21, 16 November 2010 | Rorschach Protocol.JPG (file) |  |
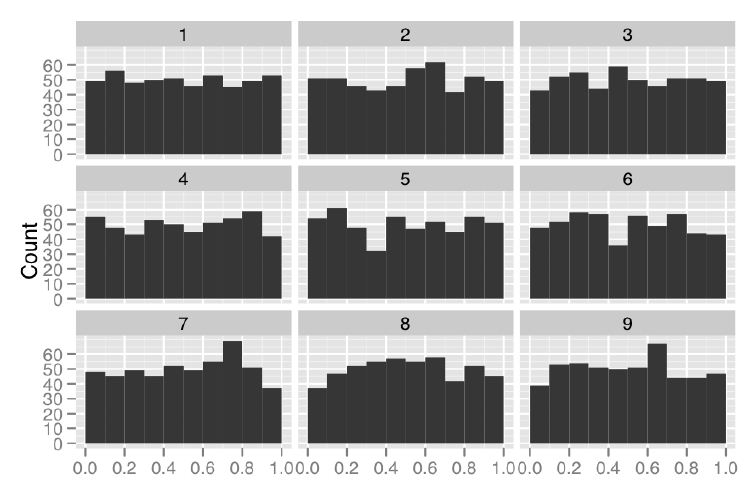
54 KB | Rorschach protocol: Nine histograms summarizing the accuracy at which 500 participants perform nine tasks. What do you see? | 1 |
| 01:03, 17 November 2010 | Line-Up-Cancer Deaths in Texas.JPG (file) | 50 KB | Graphical Inference for InfoVis, Line-up: One of these plots doesn’t belong. These six plots show choropleth maps of cancer deaths in Texas, where darker colors = more deaths. Can you spot which of the six plots is made from a real dataset and not simul | 1 | |
| 19:19, 17 January 2011 | Watervis-stackedtimeseries.jpg (file) |  |
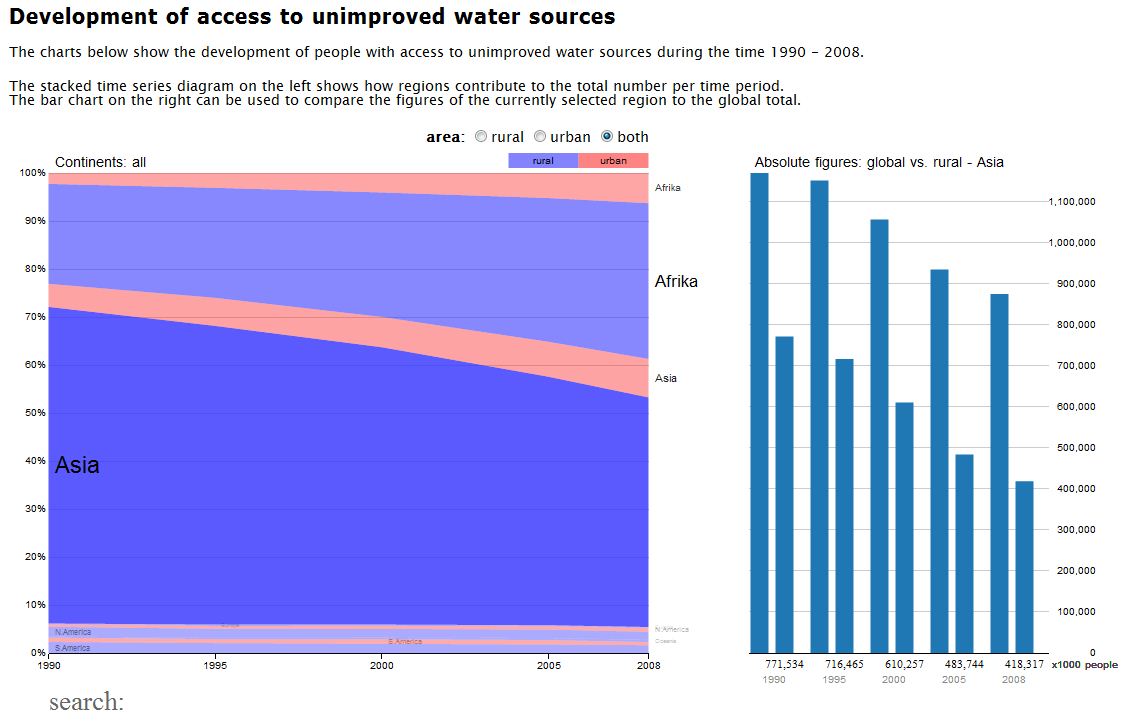
101 KB | The visualisation shows the development of access to unimproved water sources, based on data from the Joint Monitoring Program for Water Supply and Sanitation (JMP) of the World Health Organization (WHO) and the UN Children’s Fund (UNICEF). http://www.w | 2 |