File list
Jump to navigation
Jump to search
This special page shows all uploaded files.
| Date | Name | Thumbnail | Size | User | Description | Versions |
|---|---|---|---|---|---|---|
| 15:11, 21 October 2008 | Rind alexander 13770 75x100.jpg (file) |  |
3 KB | UE-InfoVis0809 9825992 (talk | contribs) | Photo of Alex | 1 |
| 15:56, 21 October 2008 | Nopic.jpg (file) |  |
20 KB | UE-InfoVis0809 0526476 (talk | contribs) | 1 | |
| 17:41, 21 October 2008 | Kw sp.jpg (file) |  |
45 KB | UE-InfoVis0809 0425160 (talk | contribs) | www.sp-studio.de | 1 |
| 10:10, 22 October 2008 | Foto0426716.jpg (file) |  |
56 KB | UE-InfoVis0809 0426716 (talk | contribs) | 1 | |
| 10:44, 22 October 2008 | Guten morgen.jpg (file) |  |
17 KB | Farukp (talk | contribs) | Guten Morgen FARUK! | 1 |
| 21:41, 24 October 2008 | Duty calls.png (file) |  |
14 KB | UE-InfoVis0809 0309104 (talk | contribs) | [Munroe,2008] xkcd - A Webcomic. Created at: May 30, 2008. Retrieved at: May 30, 2008. http://xkcd.com/386/ | 1 |
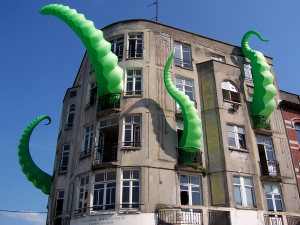
| 22:22, 24 October 2008 | Octobuilding.jpg (file) |  |
90 KB | UE-InfoVis0809 0309104 (talk | contribs) | [kenfan,2008] Flickr - Photo-Sharing!. Created at: July 9, 2008. Retrieved at: Oct 25, 2008. http://flickr.com/photos/83472180@N00/2654021441/ | 1 |
| 22:35, 24 October 2008 | Journal 4.png (file) |  |
4 KB | UE-InfoVis0809 0309104 (talk | contribs) | [Munroe,2008] xkcd - A Webcomic. Created at: June 4, 2008. Retrieved at: Oct 25, 2008. http://xkcd.com/432/ | 1 |
| 12:30, 25 October 2008 | Pic0201183.jpg (file) |  |
41 KB | UE-InfoVis0809 0201183 (talk | contribs) | Picture of me! | 1 |
| 13:15, 27 October 2008 | Chrisi.jpg (file) |  |
29 KB | UE-InfoVis0809 0326850 (talk | contribs) | Christian Fischl | 1 |
| 21:00, 27 October 2008 | UE-InfoVis0809 0425646.jpg (file) |  |
60 KB | UE-InfoVis0809 0425646 (talk | contribs) | 1 | |
| 01:54, 28 October 2008 | Pwm.jpg (file) |  |
14 KB | UE-InfoVis0809 0225026 (talk | contribs) | Philipp Mayer | 1 |
| 16:53, 28 October 2008 | Bild.png (file) |  |
40 KB | UE-InfoVis0809 0728258 (talk | contribs) | 1 | |
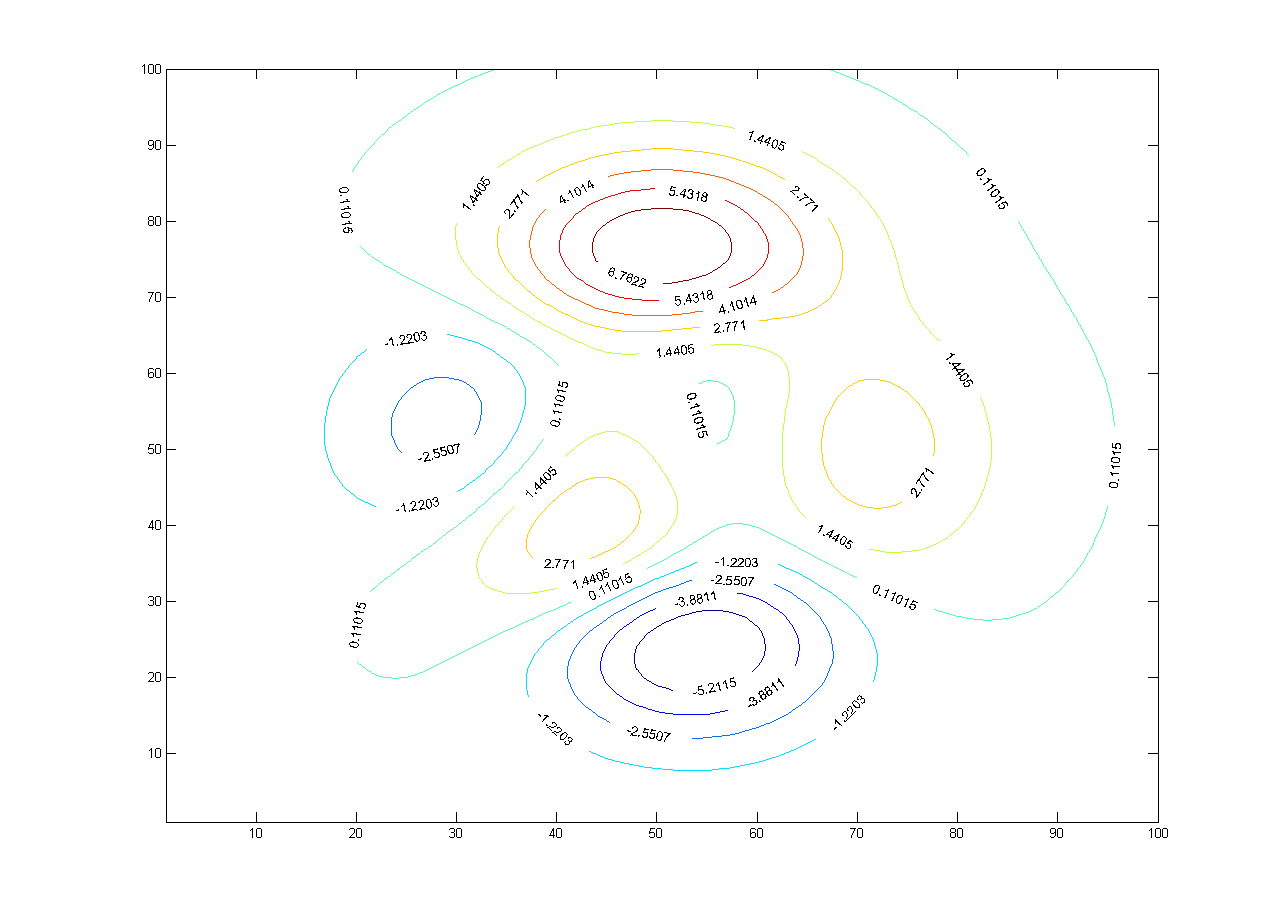
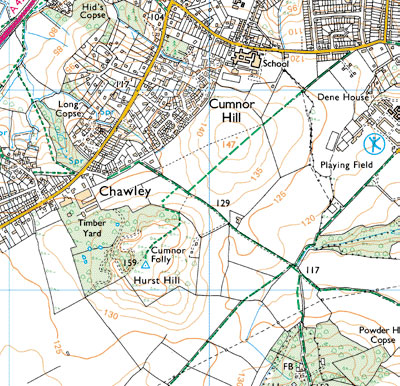
| 09:16, 30 October 2008 | Contour map.png (file) |  |
25 KB | UE-InfoVis0809 0426276 (talk | contribs) | A contour map contains multiple contour lines. Each line represents a constant level within the map. | 1 |
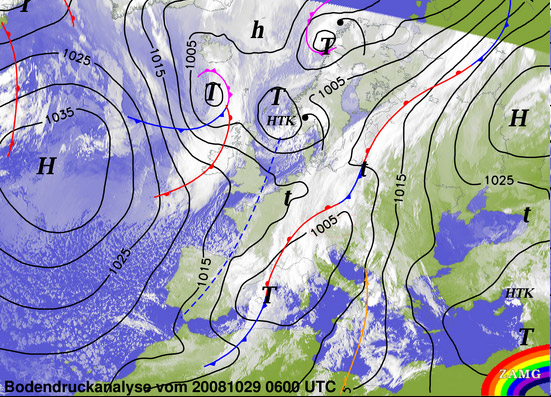
| 09:43, 30 October 2008 | Weather map.jpg (file) |  |
133 KB | UE-InfoVis0809 0426276 (talk | contribs) | The map shows the analysis of the weather condition. | 1 |
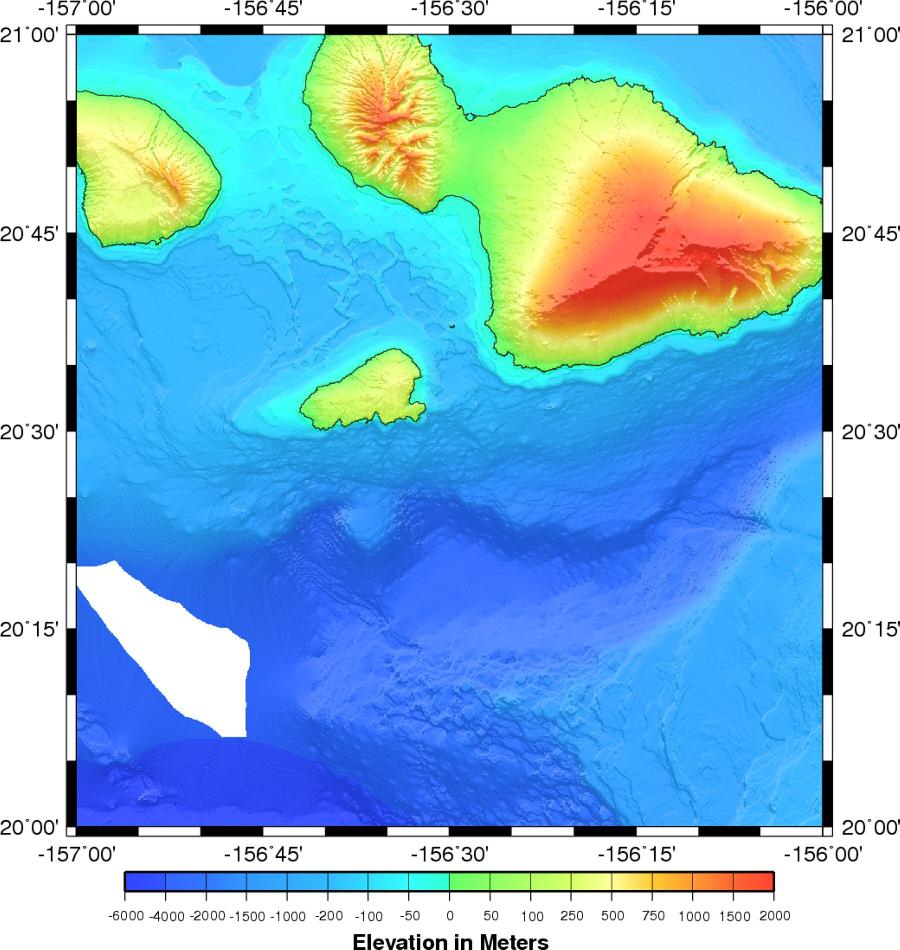
| 12:12, 30 October 2008 | Ocean contour map.jpg (file) |  |
150 KB | UE-InfoVis0809 0426276 (talk | contribs) | ocean contour map | 1 |
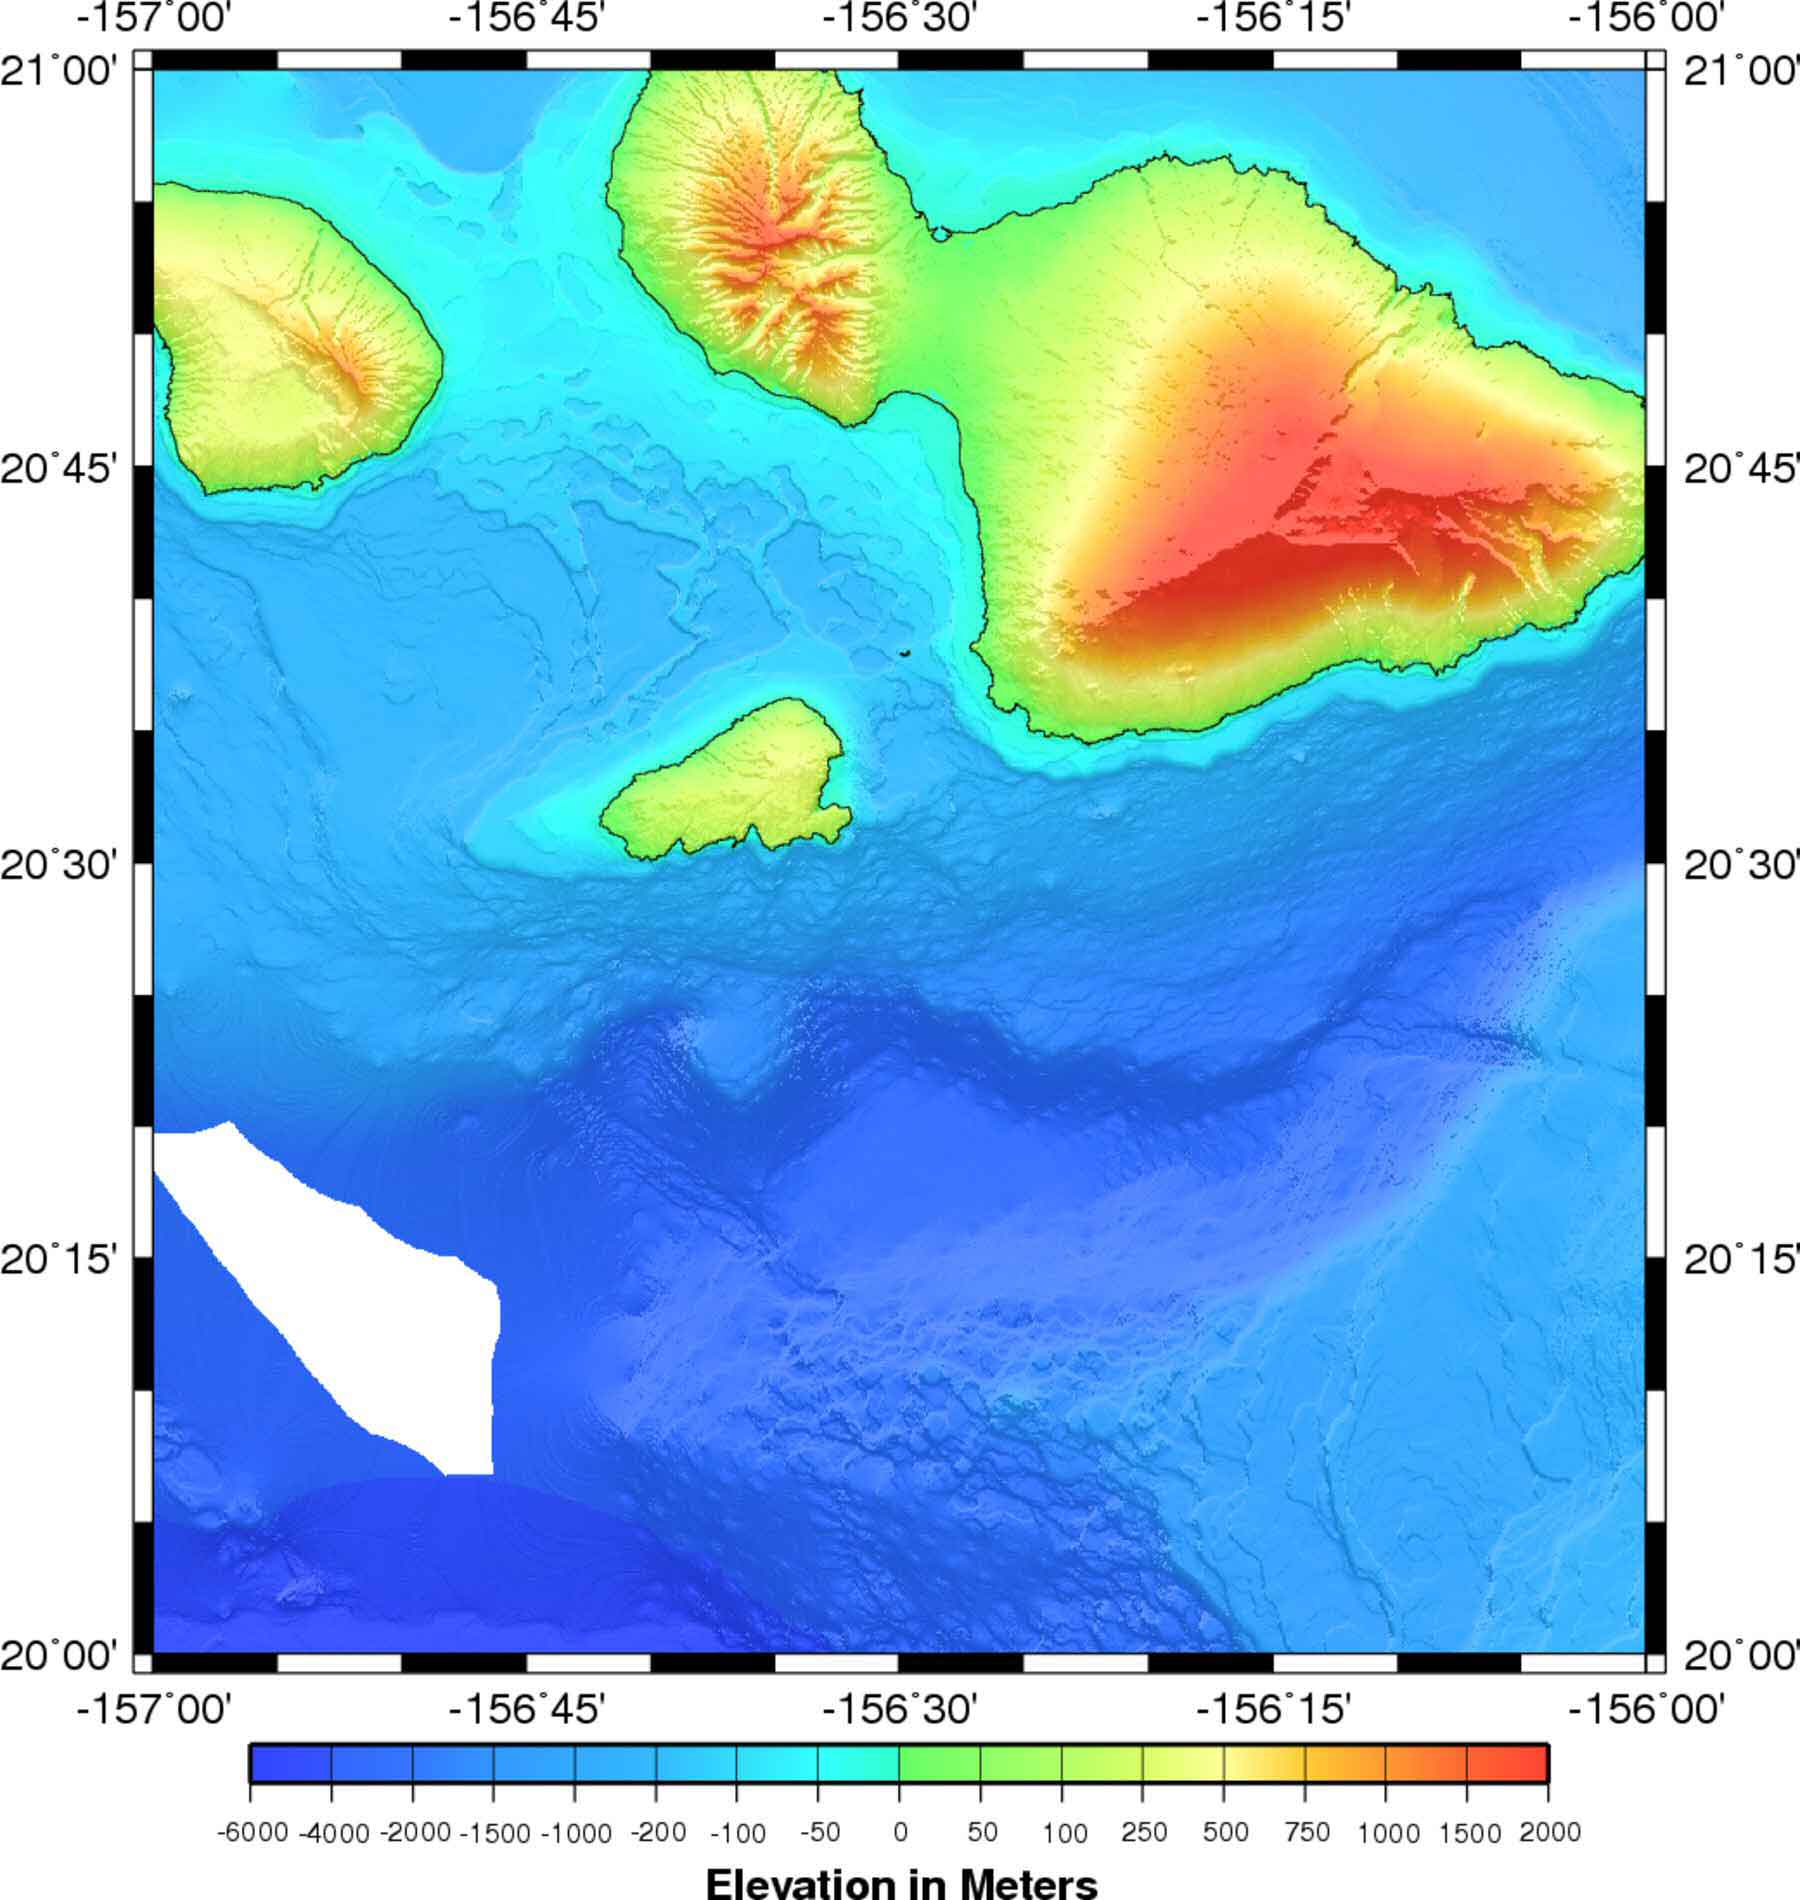
| 12:29, 30 October 2008 | Bathymetry.jpg (file) |  |
118 KB | UE-InfoVis0809 0426276 (talk | contribs) | ocean contour map | 1 |
| 15:03, 30 October 2008 | Hierarchy0426716.gif (file) |  |
5 KB | UE-InfoVis0809 0426716 (talk | contribs) | 1 | |
| 15:05, 30 October 2008 | Examples0426716.gif (file) |  |
9 KB | UE-InfoVis0809 0426716 (talk | contribs) | 1 | |
| 09:10, 31 October 2008 | Topographic map.jpg (file) |  |
87 KB | UE-InfoVis0809 0426276 (talk | contribs) | 1 | |
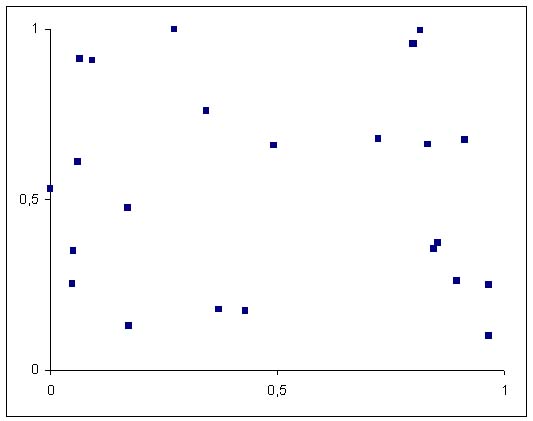
| 11:14, 2 November 2008 | NoCorrelation.jpg (file) |  |
24 KB | UE-InfoVis0809 9607701 (talk | contribs) | Scatterplot of uncorrelated variables. | 1 |
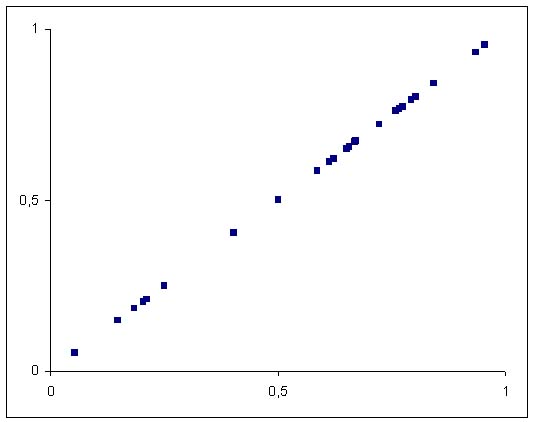
| 11:15, 2 November 2008 | PerfectPositiveCorrelation.jpg (file) |  |
23 KB | UE-InfoVis0809 9607701 (talk | contribs) | Scatterplot of two variables with perfectly positive correlation. | 1 |
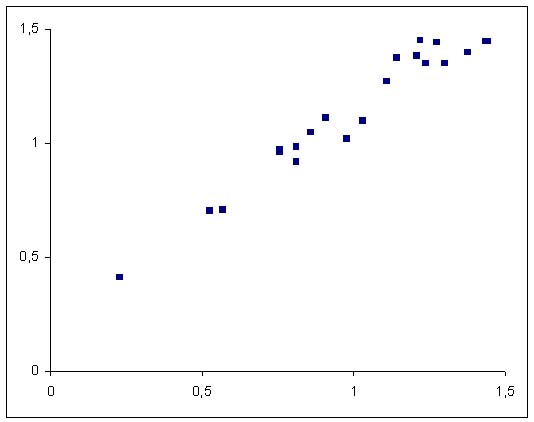
| 11:16, 2 November 2008 | StrongPositiveCorrelation.jpg (file) |  |
24 KB | UE-InfoVis0809 9607701 (talk | contribs) | Scatterplot of two variables with strong positive correlation. | 1 |
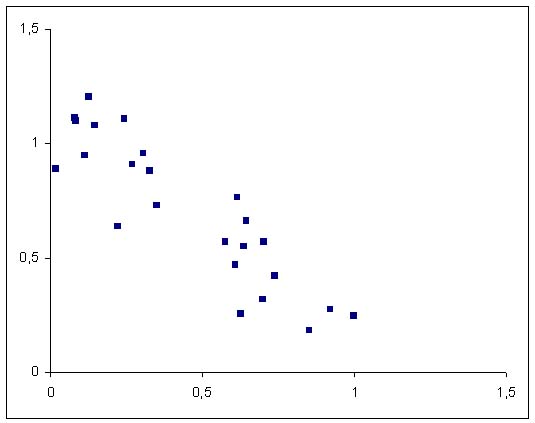
| 11:16, 2 November 2008 | WeakNegativeCorrelation.jpg (file) |  |
24 KB | UE-InfoVis0809 9607701 (talk | contribs) | Scatterplot of two variables with weak negative correlation. | 1 |
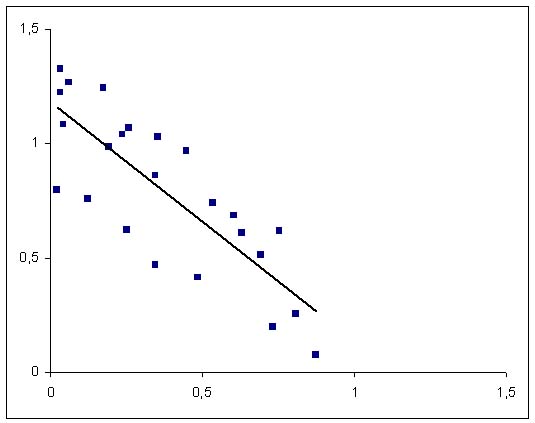
| 11:17, 2 November 2008 | WeakNegativeCorrelationLine.jpg (file) |  |
28 KB | UE-InfoVis0809 9607701 (talk | contribs) | Scatterplot of two variables with weak negative correlation, featuring regression line. | 1 |
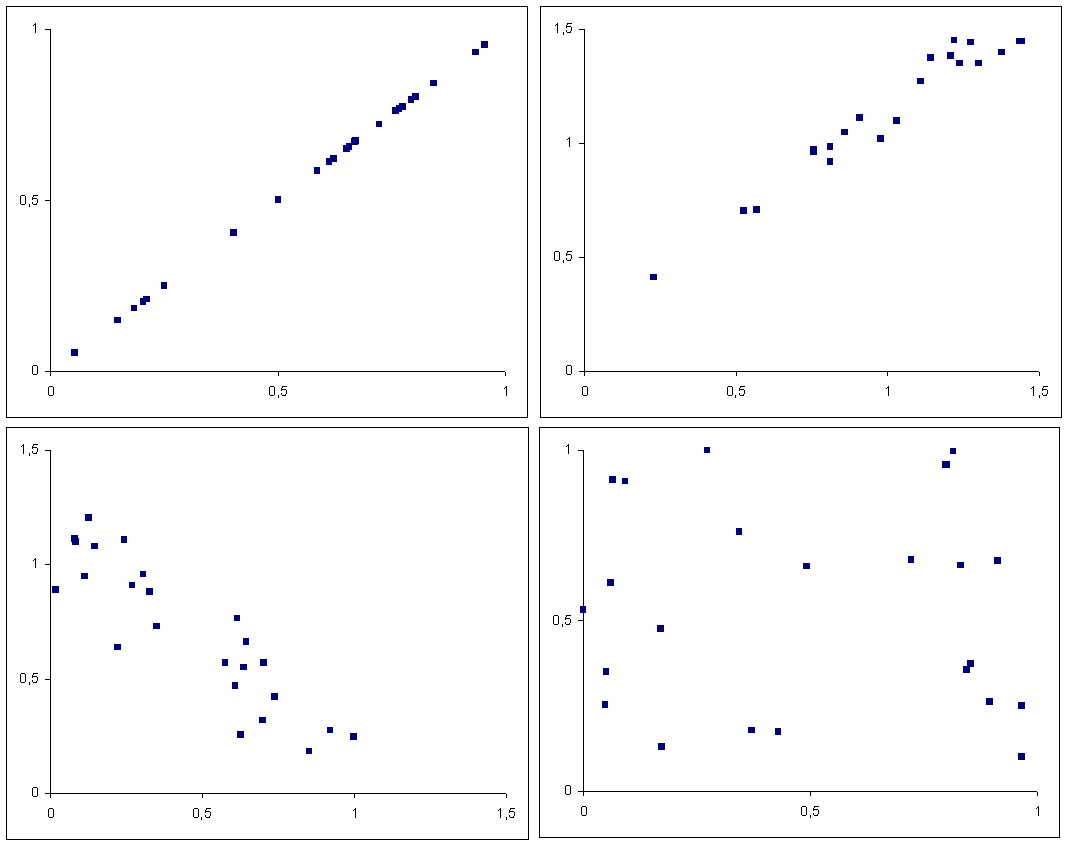
| 11:28, 2 November 2008 | SomeScatterplots.jpg (file) |  |
63 KB | UE-InfoVis0809 9607701 (talk | contribs) | Some scatterplots: perfect positive, strong positivve, weak negative and one with no corellation among variables. | 1 |
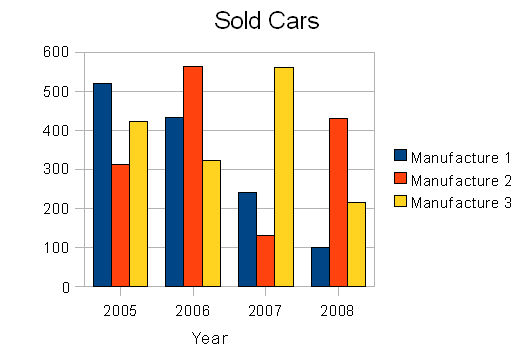
| 20:27, 2 November 2008 | Barchart.png (file) |  |
9 KB | UE-InfoVis0809 0827047 (talk | contribs) | Sample of a bar chart | 1 |
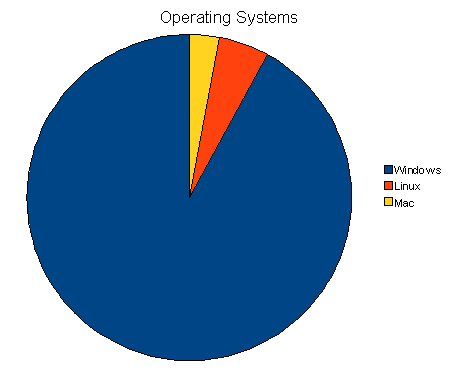
| 20:43, 2 November 2008 | Piechart.png (file) |  |
7 KB | UE-InfoVis0809 0827047 (talk | contribs) | 1 | |
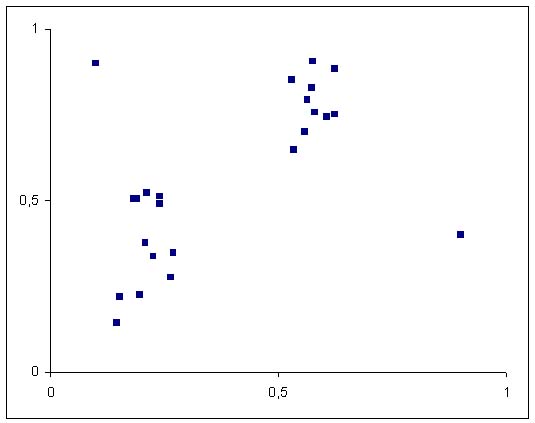
| 21:47, 2 November 2008 | ClustersOutlyers.jpg (file) |  |
24 KB | UE-InfoVis0809 9607701 (talk | contribs) | Scatterplot with two recognizable clusters and outlyers. | 1 |
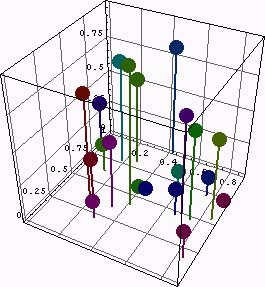
| 21:49, 2 November 2008 | PinPlot543.jpg (file) |  |
45 KB | UE-InfoVis0809 9607701 (talk | contribs) | Scatterplot with thir axis. Created with Mathematica's PinPlot3D command. Taken from "library.wolfram.com". | 1 |
| 10:30, 3 November 2008 | Pc example car.gif (file) |  |
109 KB | UE-InfoVis0809 0126665 (talk | contribs) | 1 | |
| 10:34, 3 November 2008 | Pc figure1.gif (file) |  |
9 KB | UE-InfoVis0809 0126665 (talk | contribs) | 1 | |
| 10:35, 3 November 2008 | Pc extrude.gif (file) |  |
8 KB | UE-InfoVis0809 0126665 (talk | contribs) | 1 | |
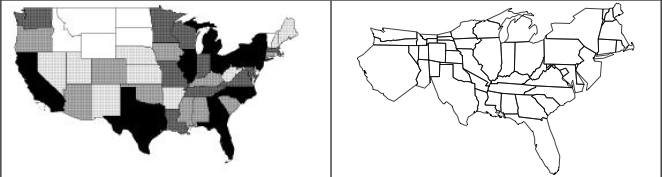
| 13:38, 3 November 2008 | USA1.png (file) | 57 KB | UE-InfoVis0809 0427537 (talk | contribs) | 1 | ||
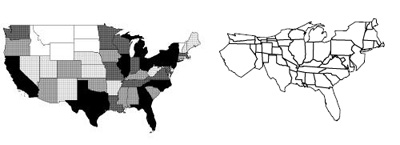
| 13:43, 3 November 2008 | USA2.jpg (file) |  |
30 KB | UE-InfoVis0809 0325767 (talk | contribs) | 1 | |
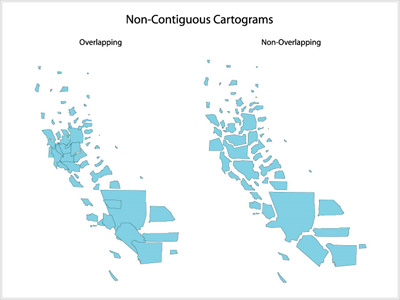
| 14:10, 3 November 2008 | Noncont.jpg (file) |  |
46 KB | UE-InfoVis0809 0325767 (talk | contribs) | 1 | |
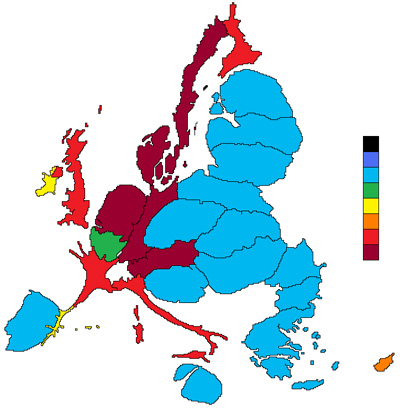
| 14:23, 3 November 2008 | Europe.jpg (file) |  |
91 KB | UE-InfoVis0809 0325767 (talk | contribs) | 1 | |
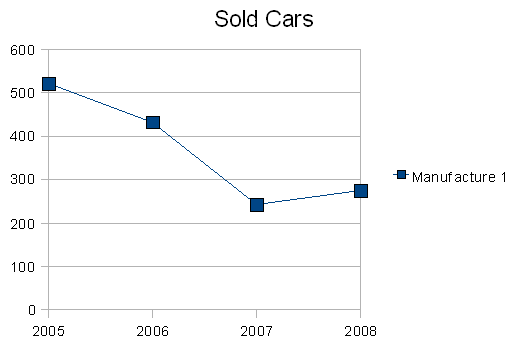
| 20:53, 3 November 2008 | Linechart.png (file) |  |
8 KB | UE-InfoVis0809 0827047 (talk | contribs) | Sample of a line chart | 1 |
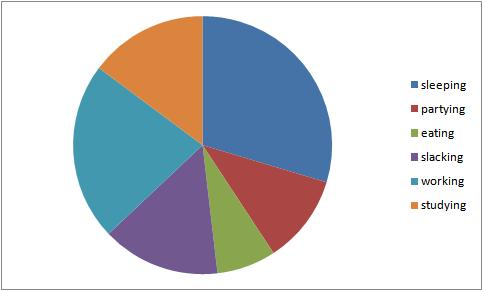
| 16:56, 4 November 2008 | Pie chart example.jpg (file) |  |
13 KB | UE-InfoVis0809 0526476 (talk | contribs) | pie chart example | 1 |
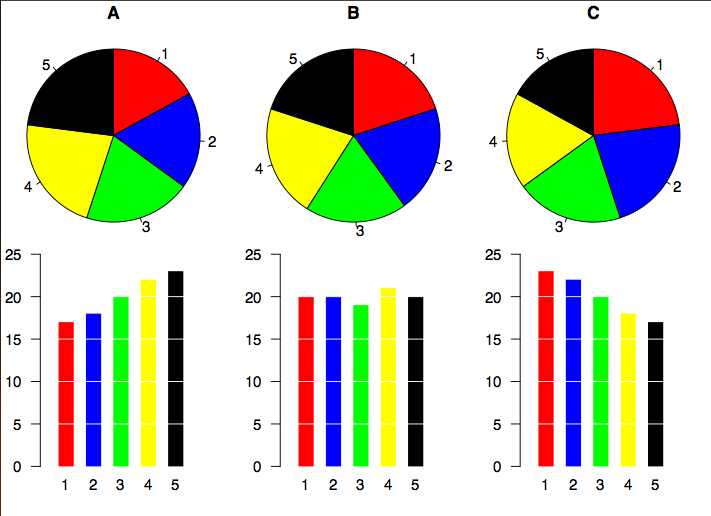
| 17:15, 4 November 2008 | PiechartsAndBars.png (file) |  |
44 KB | UE-InfoVis0809 0201680 (talk | contribs) | 1 | |
| 17:20, 4 November 2008 | Stick figure sample.JPG (file) |  |
7 KB | UE-InfoVis0809 0526476 (talk | contribs) | a stick figure example | 2 |
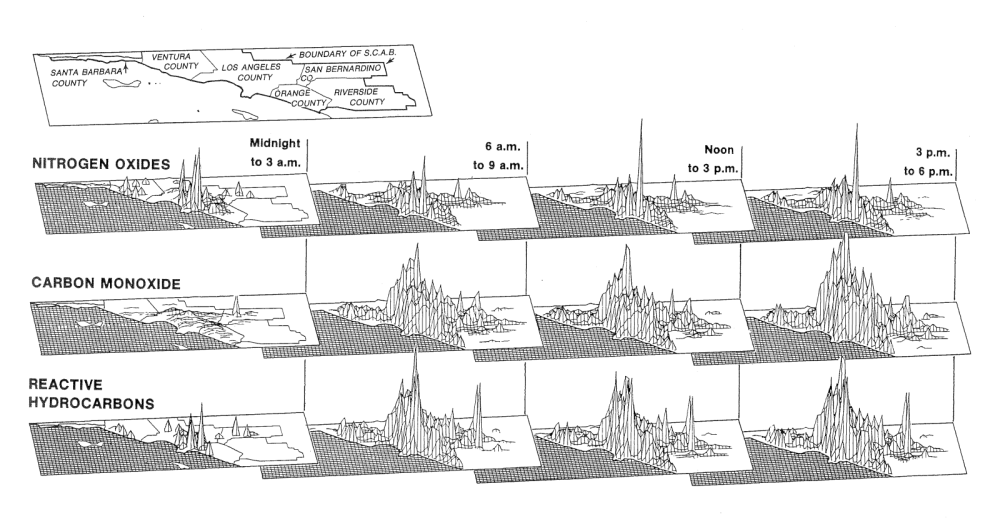
| 12:36, 5 November 2008 | Tufte 1983 small-multiple la-pollution.png (file) |  |
146 KB | UE-InfoVis0809 9825992 (talk | contribs) | Small multiples to visualize pollution in southern California | 1 |
| 15:50, 5 November 2008 | Top25newspapers.gif (file) |  |
41 KB | Martha Kaltenecker (talk | contribs) | 1 | |
| 16:22, 5 November 2008 | Trace stats04.gif (file) |  |
8 KB | Martha Kaltenecker (talk | contribs) | 1 | |
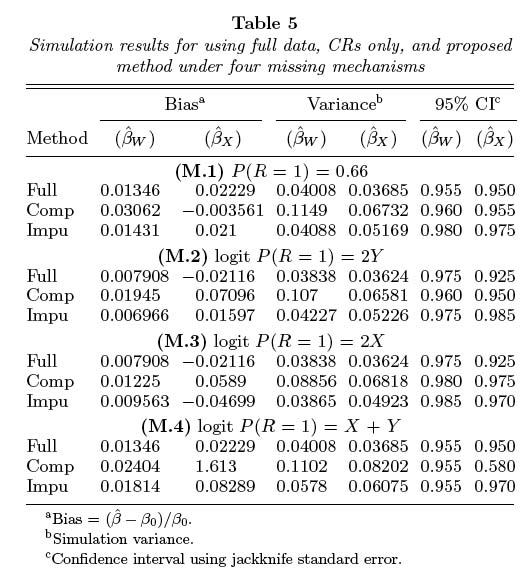
| 16:32, 5 November 2008 | Simuresults.jpg (file) |  |
111 KB | Martha Kaltenecker (talk | contribs) | 1 | |
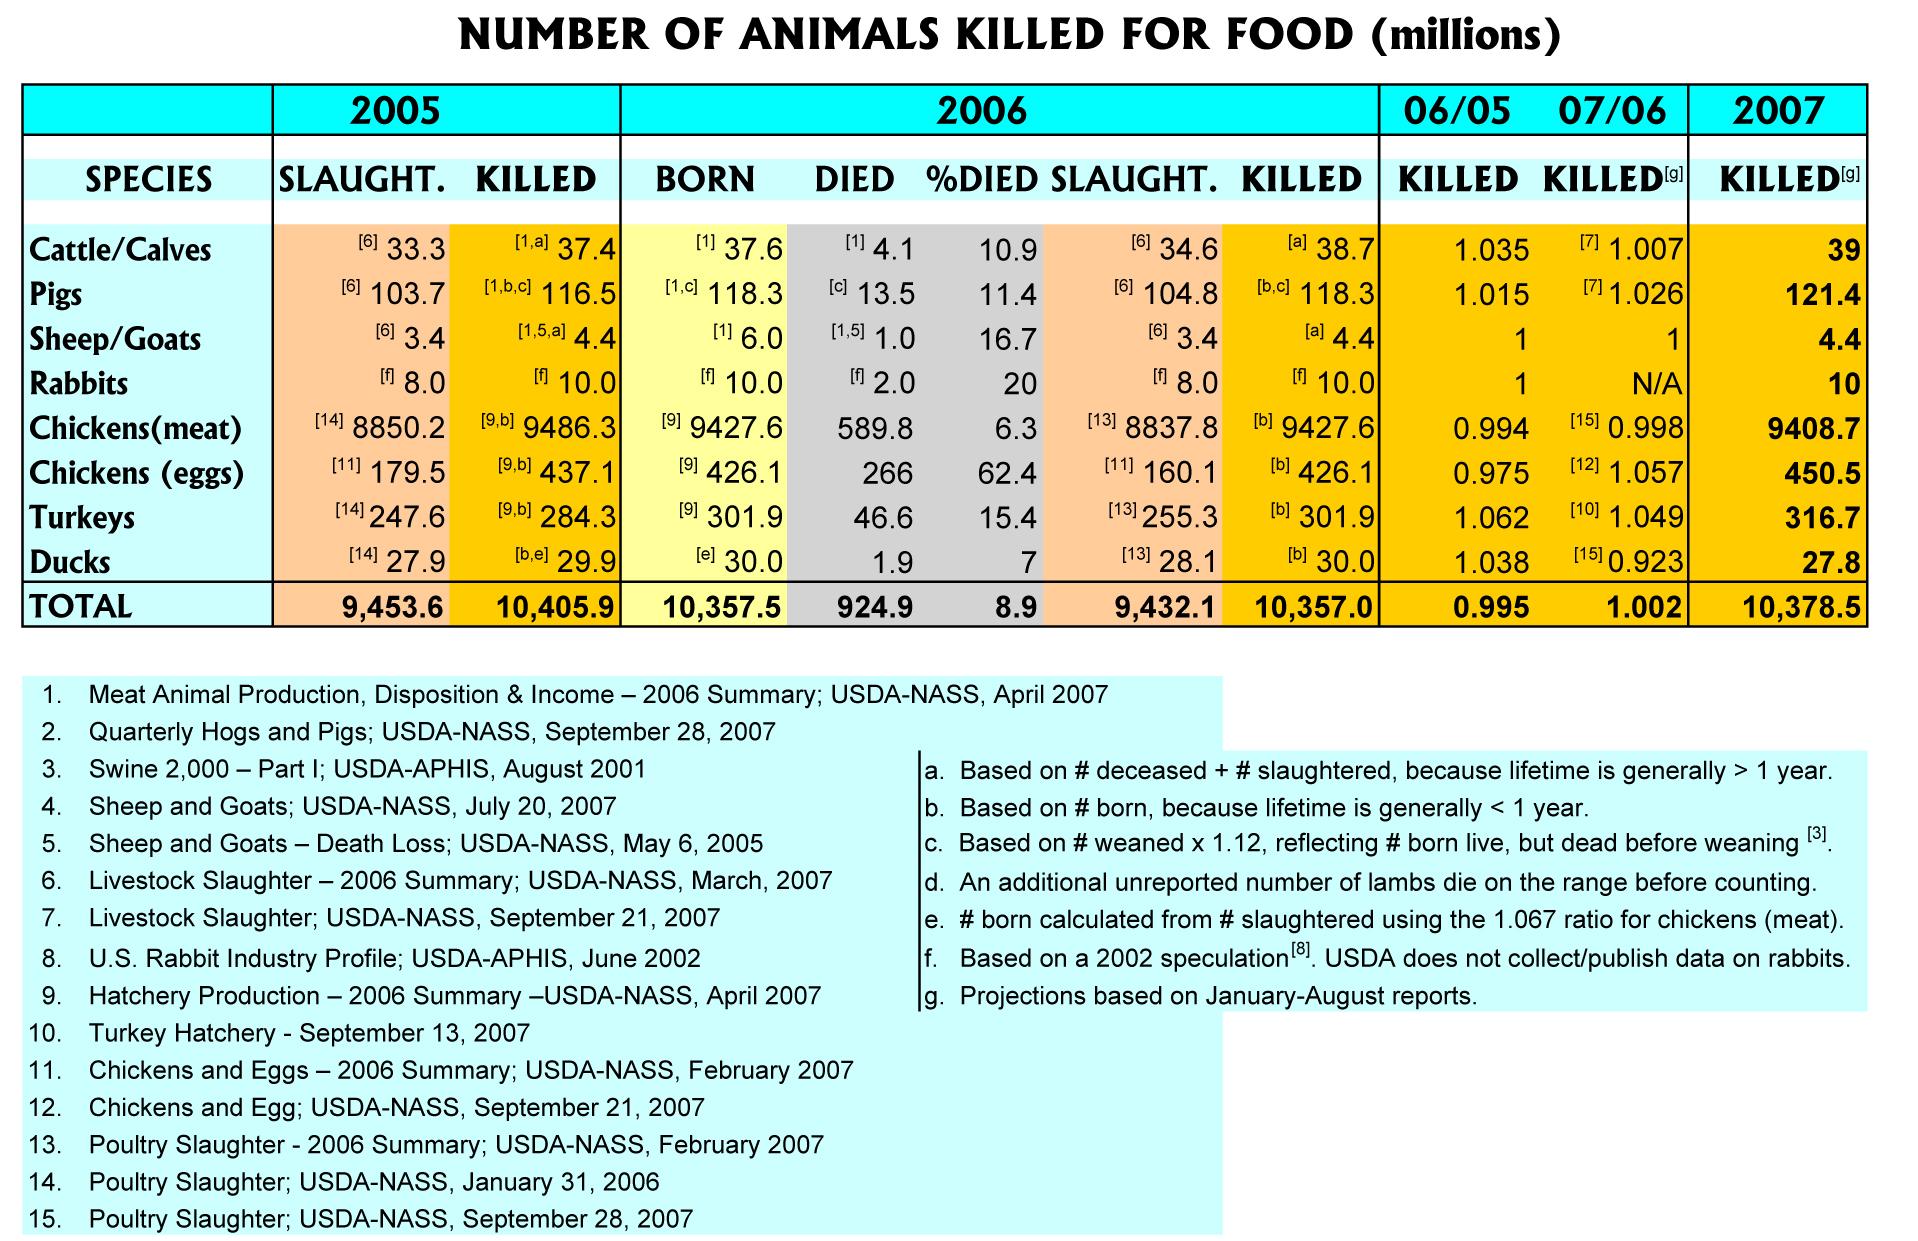
| 16:41, 5 November 2008 | AnimalsKilledforFood.jpg (file) |  |
407 KB | Martha Kaltenecker (talk | contribs) | 1 | |
| 17:04, 5 November 2008 | Table2 wilmarth.gif (file) |  |
11 KB | Martha Kaltenecker (talk | contribs) | 1 | |
| 17:06, 5 November 2008 | Table3 wilmarth.gif (file) |  |
9 KB | Martha Kaltenecker (talk | contribs) | 1 | |
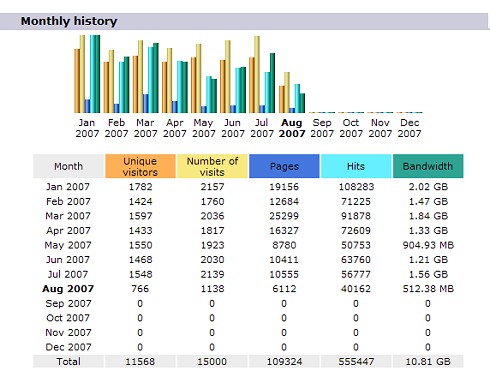
| 17:21, 5 November 2008 | Web statistics.jpg (file) |  |
53 KB | Martha Kaltenecker (talk | contribs) | 1 | |
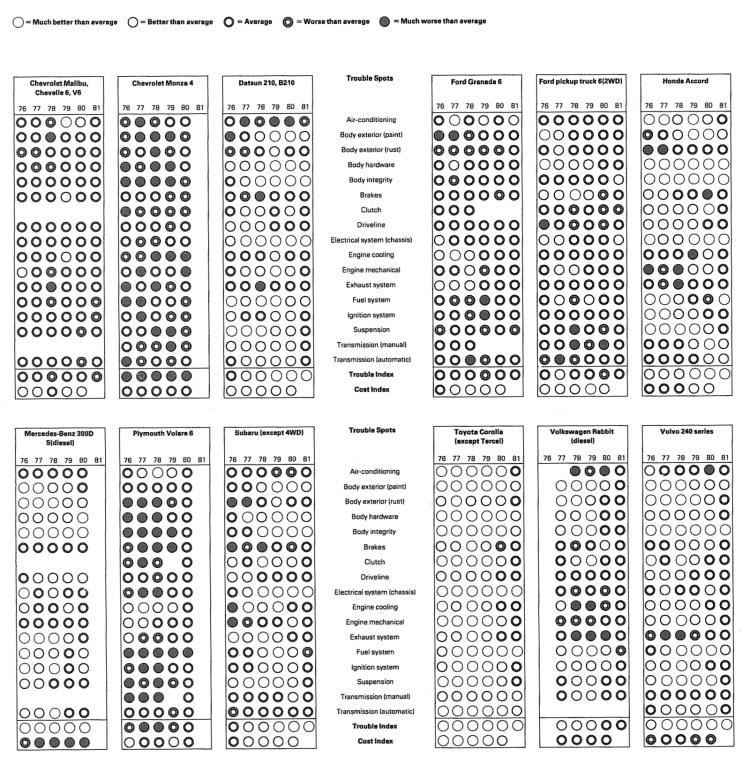
| 19:03, 5 November 2008 | Tufte 2001 small-multiple cars.png (file) |  |
217 KB | UE-InfoVis0809 9825992 (talk | contribs) | Small multiples to visualize frequency-of-repair for cars | 1 |