File:The Legend as statistical graphic.jpg
The_Legend_as_statistical_graphic.jpg (703 × 203 pixels, file size: 49 KB, MIME type: image/jpeg)
Summary[edit]
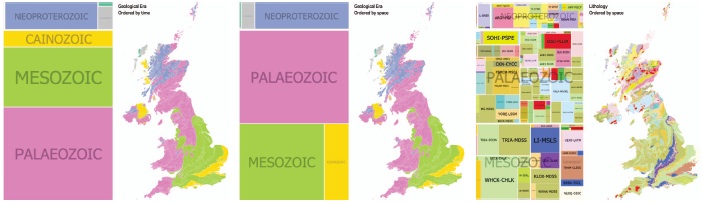
The Legend as Statistical Graphic – Hierarchy. Three legend / map pairs show bedrock geology for the United Kingdom in Prototype 4. Areas on the legend relate to areas on the map for era (left, center) and lithology (right). The legend can be interactively reordered to show chronological (left), geospatial (center, right) or attribute orders at and for each level of the attribute hierarchy.
Copyright status[edit]
Copyright : British Geological Survey
Source[edit]
[Dykes et al. 2010] Jason Dykes, Jo Wood, Aidan Slingsby. Rethinking Map Legends with Visualization. IEEE Transactions on Visualization and Computer Graphics, 16(6): 890 - 899 (Fig.3) , November/December 2010
File history
Click on a date/time to view the file as it appeared at that time.
| Date/Time | Thumbnail | Dimensions | User | Comment | |
|---|---|---|---|---|---|
| current | 23:21, 17 November 2010 | 703 × 203 (49 KB) | UE-InfoVis1011 0325435 (talk | contribs) | The Legend as Statistical Graphic – Hierarchy. Three legend / map pairs show bedrock geology for the United Kingdom in Prototype 4. Areas on the legend relate to areas on the map for era (left, center) and lithology (right). The legend can be interactiv |
You cannot overwrite this file.
File usage
The following page uses this file: