File:NYT-Chart.png
Jump to navigation
Jump to search
Size of this preview: 692 × 599 pixels. Other resolution: 1,270 × 1,100 pixels.
Original file (1,270 × 1,100 pixels, file size: 39 KB, MIME type: image/png)
File history
Click on a date/time to view the file as it appeared at that time.
| Date/Time | Thumbnail | Dimensions | User | Comment | |
|---|---|---|---|---|---|
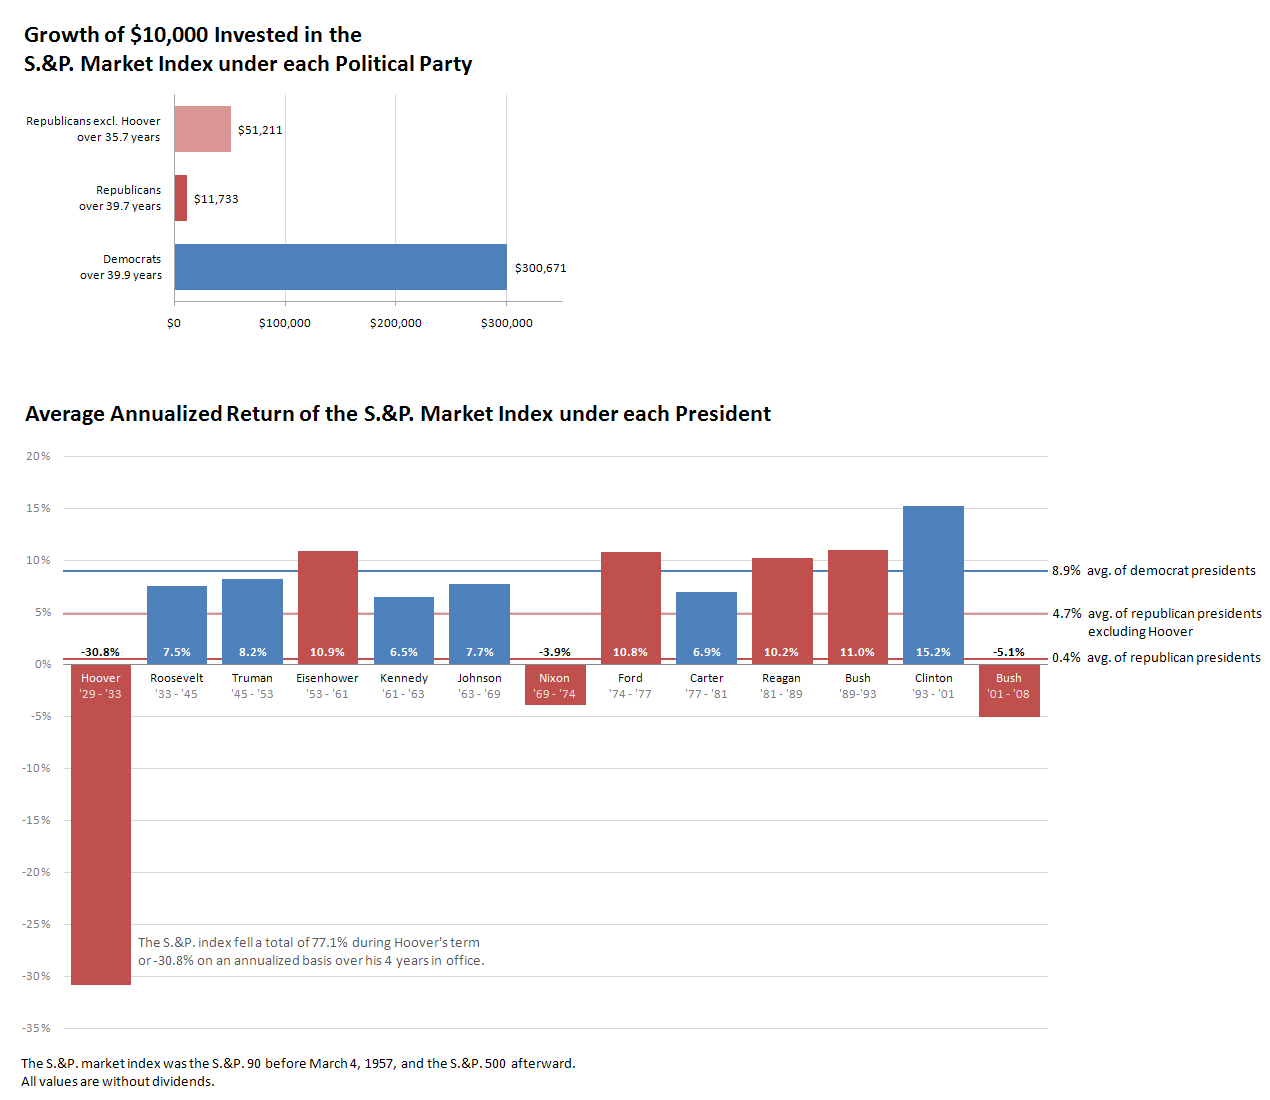
| current | 21:03, 8 December 2009 | | 1,270 × 1,100 (39 KB) | Hiro (talk | contribs) | Growth of $100,000 Invested in the S.&P. Market Index under each Political Party and Average Annualized Return of the S.&P. Market Index under each President |
You cannot overwrite this file.
File usage
The following page uses this file: