Visual Exploration of Multivariate Graphs by Roll-Up and Selection

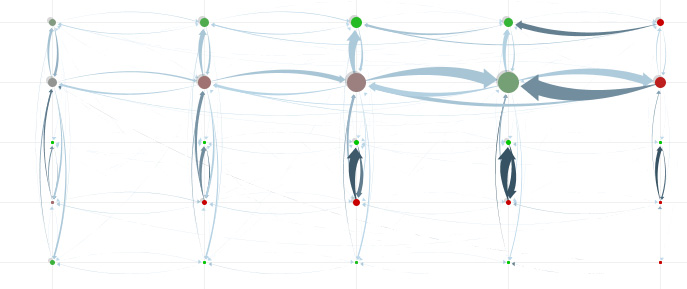
Multivariate diagramm rolled up in two dimensions [Wattenberg, 2006]
Martin Wattenberg [Wattenberg, 2006] described in his paper Visual Exploration of Multivariate Graphs how Multivariate Graphs can be easily analyzed by rolling-up on certain dimensions. The paper focuses on a software tool called PivotGraph (unfortunately not available) but describes a strategy that could also be used in other tools.
[Wattenberg, 2006]
Multivariate graphs - common approach
Two visualizations of multivariate graphs are very popular: "Node-and-link diagrams" and matrix views. "Node-and-link diagrams" represent a network topography, additional information may be coded by labeling and coloring nodes, matrix views (normally only 2D) create a main-matrix of one characteristic in which the sub-characteristic is repeated.
Problems in analyzing multivariate graphs
Both visualizations - node-and-link diagram and matrix diagram allow only poor analysis of the information contained in the nodes. Easy questions like "How many men are in the network?" may require the analysist to count every node.

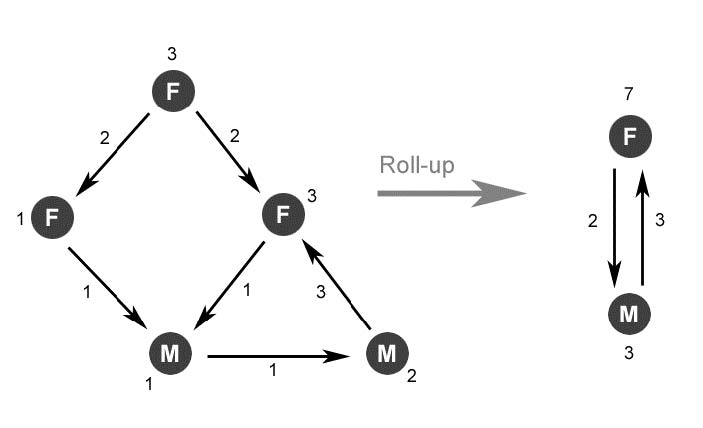
Rolling up a simple network diagram on the “gender” dimension [Wattenberg, 2006]
Solution: Roll-up on one (two) dimension(s)
The main simplification in PivotGraph is to roll a graph up in any dimension(s): Replace all nodes with the same value in these dimensions with a node representing the amount of nodes by its size. Aggregate the connections in the same way.
This way you can select up to two dimensions that form a grid, e.g. gender and company. Instead of the large graph, you receive a simpler graph showing the aggregated connections between nodes that correspond to a certain gender and a certain company.

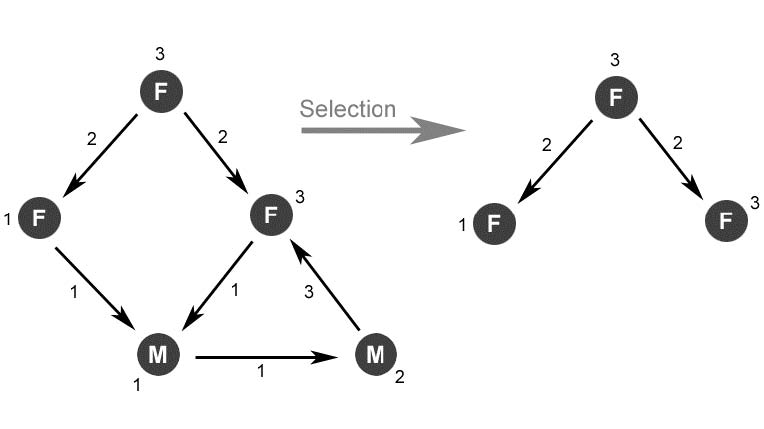
Selecting along a node attribute in a social network (gender=female) [Wattenberg, 2006]
Solution: Selection
As addition to roll-up - parts of the diagram can be selected, e.g. all nodes representing females.
Considerations
Advantages and disadvantages
Limitations
Although the technique - 2D - discrite values to roll up ...