Teaching:TUW - UE InfoVis WS 2010/11 - Gruppe 05 - Aufgabe 2
Pargnostics: Screen-Space Metrics for Parallel Coordinates
Introduction
Visualization still takes place in a space with a limited number of discrete pixels. The result of this often is over-plotting, clutter or other things. Most of the time this structures are avoided. But sometimes this artifacts can be useful, because they might point out interesting structures in the data. Until know not a lot of attention is paid to the way visualzation is presented on the screen. For the case of parallel coordinates so called Pargnostics (Parallel coordinates diagnostics) should act as a bridge between the created visualization and the perceptual system of the user. Based on metrics it's possible to provide an optimization which maximize or minimize certain visual artifacts.
Metrics

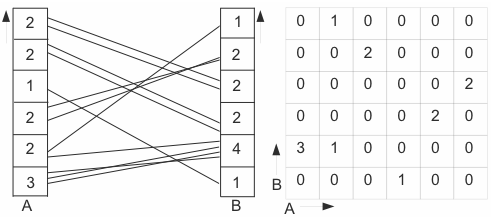
To automatically enhance the analytical tasks of users Dasgupta and Kosara [2010] proposed several metrics. The metrics are used to measure the properties of parallel coordinates. For calculating these metrics, first pixel-space histograms need to be calculated. Pixel-space histograms discretize the lines drawn in parallel coordinates into bins - each bin being one pixel (for a total of h pixels in an axis):
- One-Dimensional Axis Histogram: A vector b containing the number of lines that start or end at this pixel - see columns A and B in figure 1.
- One-Dimensional Distance Histogram: A vector d where each component measures the slope of lines.
- Two-Dimensional Axis Pair Histogram: A matrix where each cell xi,j means that n lines are going from pixel i to pixel j - see matrix in figure 1.
The metrics proposed can be used for measuring different data properties: correlation (number of line crossings, angles of crossing), aggregation (parallelism), many-to-one/one-to-many relationships (convergence, divergence), quality (over-plotting), information density (pixel-based entropy).
Number of Line Crossings
The first metric proposed by Dasgupta and Kosara [2010] is number of line crossings. This intuitively just does what the name implies, count how many line crossings there are between two axes of the prallel coordinates. The count is efficiently calculated by using intervals as proposed by [Allen, 1983; Rit 1986] with a complexity of O(h4). This count is then normalized by the maximum number of possible crossings in order compare the metric between different axis combinations.
Angles of Crossing
Parallelism
Mutual Information
Convergence, Divergence
Over-plotting
Pixel-based Entropy
Dimension Order Optimization
Using the metrics from above helps to find an optimization of the visualization display. Normally this would be a NP-complete problem but by using a binned data model and by considering the special properties of parallel coordinates it's possible to reduce the amount of time which is needed to find optimal solutions. Using a branch-and-bound algorithm also can reduce the necessary time.
The porpuse of the branch-and-bound algorithm is to find the optimal order of axes. To do that a matrix of all axis pairs and their associated costs gets constructed. The costs are a combination of several metrics. This has to be done only once at the beginning of the algorithm.
Axis Inversions
Branch-and-Bound Optimization
Conclusion
References
- [Allen, 1983] J. Allen. Maintaining knowledge about temporal intervals. Communications of the ACM, 26:832-843, 1983.
- [Dasgupta and Kosara, 2010] Aritra Dasgupta and Robert Kosara. Pargnostics: Screen-Space Metrics for Parallel Coordinates. IEEE Transactions on Visualization and Computer Graphics, 16(6):1017-1026, November/December 2010.
- [Rit, 1986] J.-F. Rit. Propagating temporal constraints for scheduling. In Proceedings of the Fifth National COnference on Artificial Intelligence, pages 383-388, 1986