Teaching:TUW - UE InfoVis WS 2009/10 - Gruppe 03 - Aufgabe 4: Difference between revisions

From InfoVis:Wiki
Jump to navigation Jump to search
(added description of visual attributes)
 
Line 51: Line 51:
* The chosen visualization shouldn’t distract people from the most important data shown, which should be accessible as easy as possible.


== Concept ==
DXPqW3  <a href="http://xkrbvqjmmmoy.com/">xkrbvqjmmmoy</a>, [url=http://ugplszcaixoo.com/]ugplszcaixoo[/url], [link=http://huttibtprviz.com/]huttibtprviz[/link], http://xkvhmvyvikha.com/
 
The following informations can be retrieved:
 
* Day of birth and death, as well as life time of all family members:
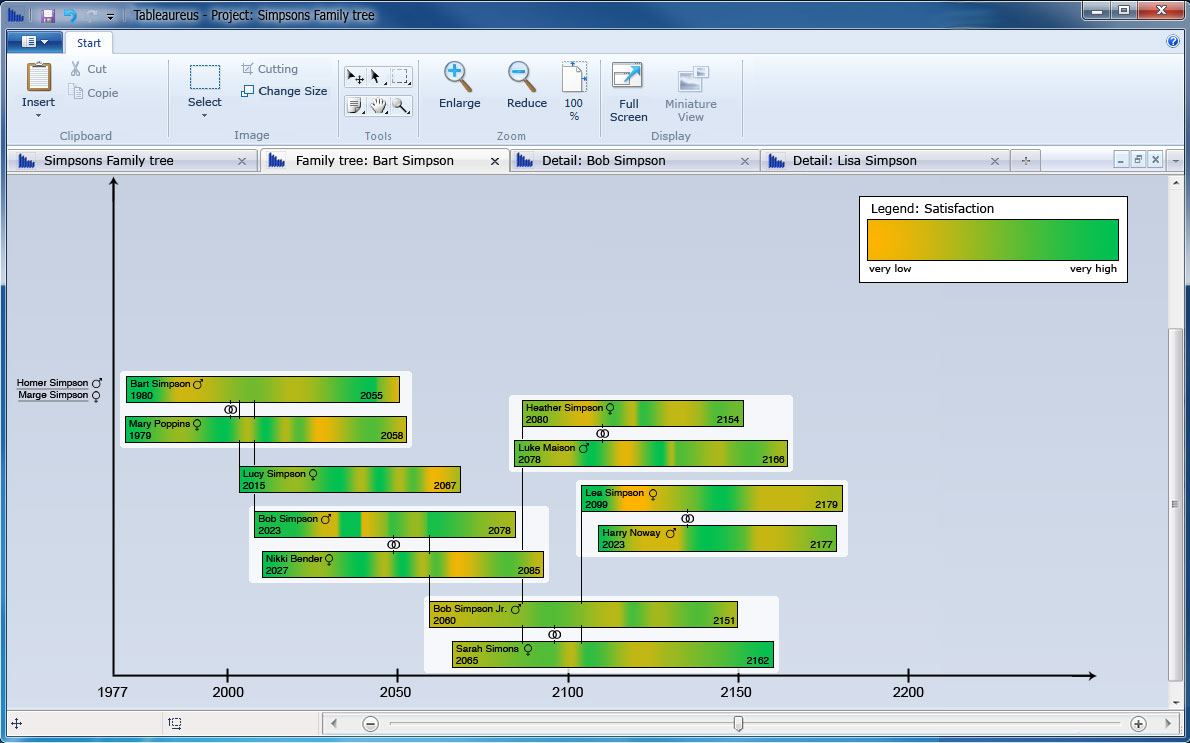
*: The family tree is shown in a horizontal timescale. The life of a person is shown by a bar, containing the name and the sex. the length of the bar shows how long the person lived, and from the position you can see the year of birth/ death, which is also written textual into the bar. More detailed informations (like the exact date of the birth, etc.) can be viewed by a details on demand technique (more later).
*: With a glaze one can see how long persons lived compared to others, when they got married or got children.
 
* The relationship (at least child-parent); difference between blood-relationship and relation through marriage:
*: When two persons get married, they are aligned next to each other vertically. When they got married is displayed by the marriage-sign.
*: The child-parent relation is shown by a line that is connecting the parents with their child(ren).
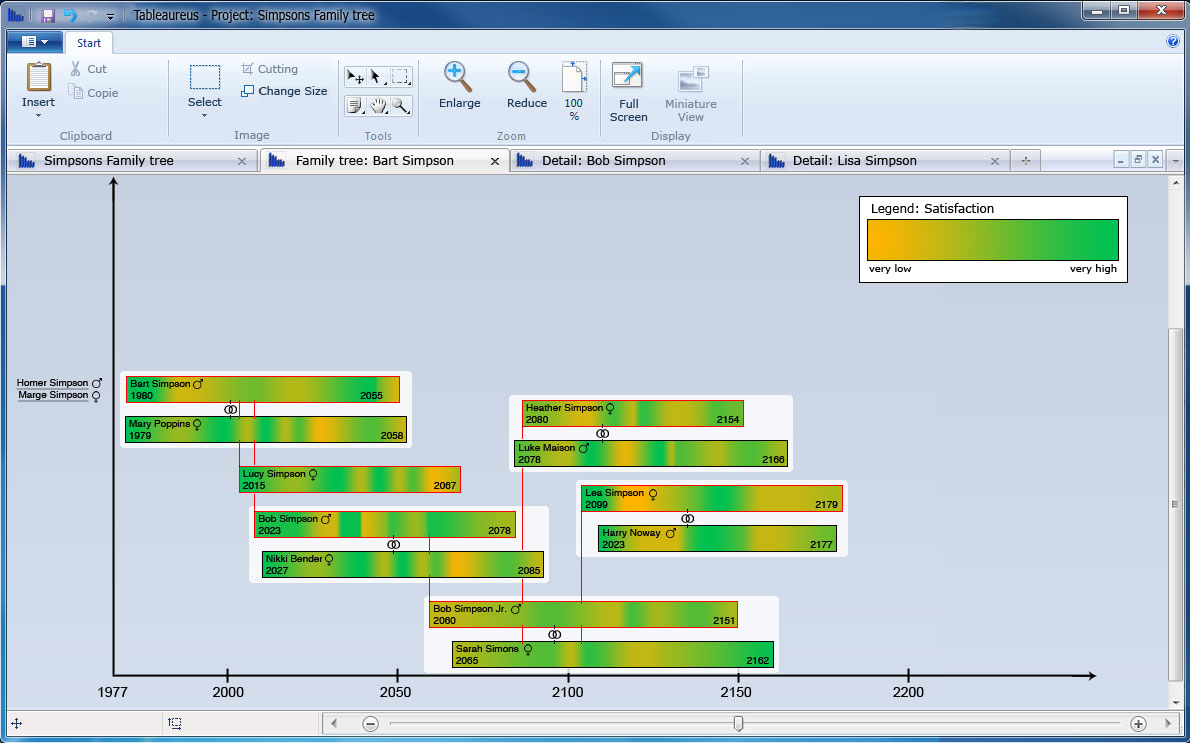
*: When a Person is marked by a single click, the (recursive) blood-relationship is displayed by red borders/ connection lines. So also relations like grandparents, grandchildren and so on can be easily seen.
 
* Important events in the life of the family members (e.g. complaints, imprisonment, school days, years of study, nobel prizes, unemployment, ...)
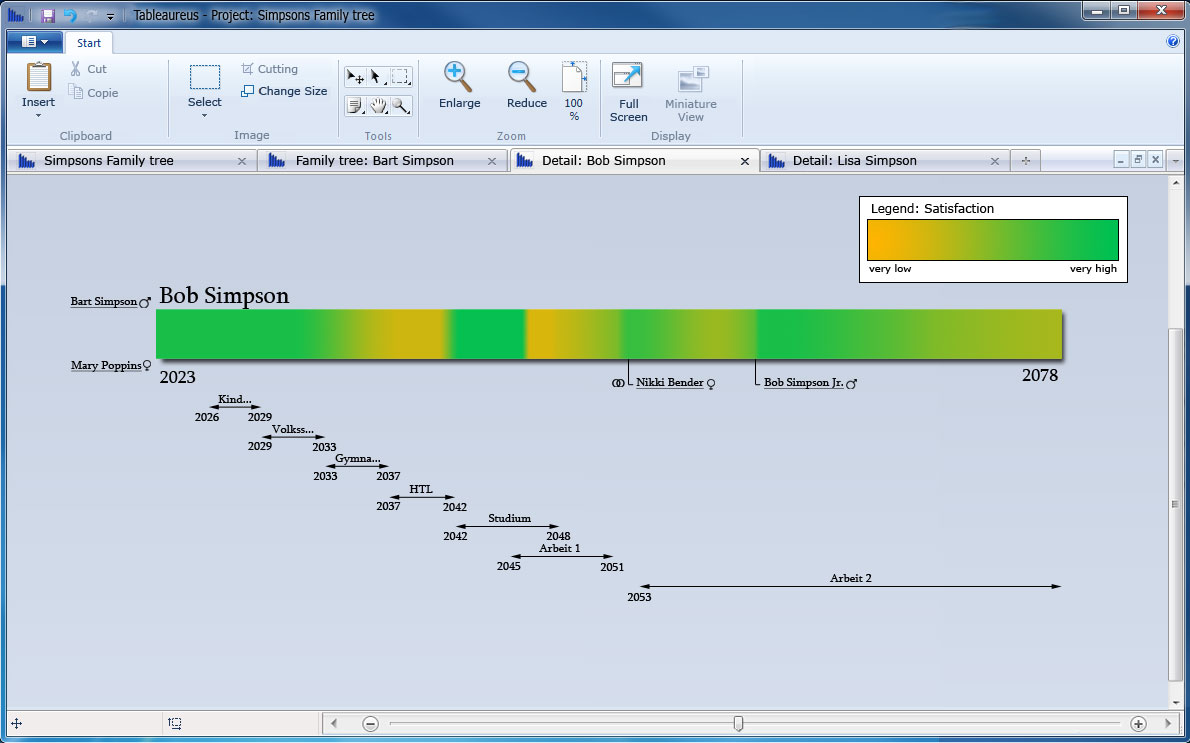
*: Double clicking on a persons bar opens up a new tab showing these informations (more later)
 
* Satisfaction of each family member (scale: very low, low, intermediate, high, very high); can be changing in the course of the life.
*: The bar (visualizing the lifespan of a person) is colored with a individual gradient, showing how the contentment of the person changed over time. Orange indicates very low satisfation, green very high satisfation. Dependent on how high the satisfaction is at a time, the color is picked from the gradient between the two main colors.
 
* The visualization should allow interaction with the data:
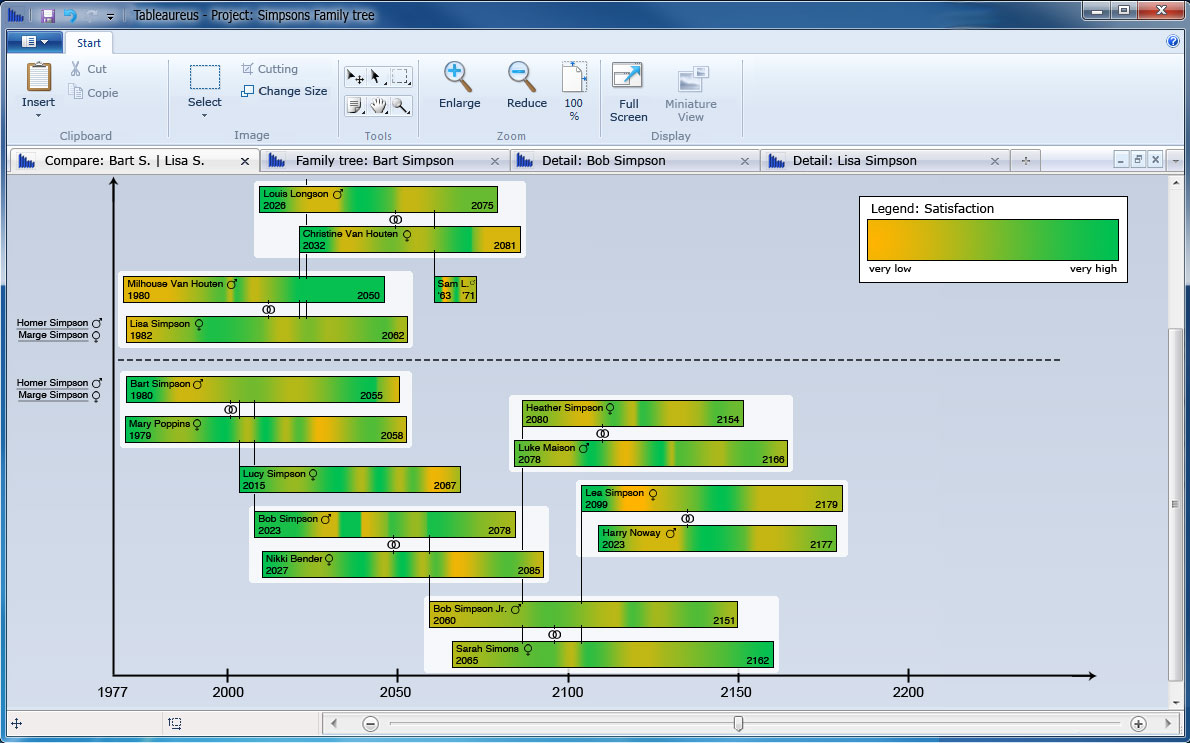
** Comparison of certain periods of life from different genealogys / comparison of periods of Barts and Lisas family trees
**: Clicking on two persons with shift pressed opens a new tab with a comparison view of the two sub trees of the persons. The two trees are split by a dashed line and aligned to the same timescale. An other possibility would be to use years of lifes as timescale which is handy for comparing the trees of persons who lived in different generations. The horizontal axis now shows the relative years passed since the birth of the persons to compare (not shown in mockups).
** At least 2 more possibilities of interaction (e.g. details on demand, filtering, ...)
*** Fading over a persons bar shows more detailed infos about its life in a popup window (like a quick tip), including day of birth, day of death, the age the person reached, and a list of important events with date (like marriage, childs born, ...) to give more exact information that can only be retrieved roughly in the overview.
*** When clicking on a person, all visible blood related persons are highlighed with red borders/ lines to visualize first-degree relations.
*** Double clicking on a persons bar, a new tab is opened showing more details about the life of the person. This informations can be educational 'milestones', information about employment, complaints, imprisonment, nobel prizes, etc.
 
* The mockups shall show at least:
** Overview of the both family trees
** Detailed comparison of two partial trees
 
* Description of visual attributes:
** The horizontal size of the bars corresponds with the length of the persons life. This is an intuitive feature, because the bars are arranged in a linear timeline.
** The fill color of the bars shows at a glance how satisfied a person was at a time. Green is often associated as good, red would be the negative counterpart, but green/red is a problematic combination for color-blind people, so orange is taken as negative color.
** Married Persons are always arranged next to each other, so that their childs can easily be connected with them.
** Colored lines (as connections between childs and parents) are only used if a person is selected, to show all blood (red color ;) ) relations.
** The sex of a person is shown by the male/ female sign, because colors would need an extra legend.


== Mockups ==
== Mockups ==

Latest revision as of 18:59, 20 August 2010

Aufgabenstellung[edit]

Beschreibung der Aufgabe 4

Zu erstellende Visualisierung[edit]


  • Stammbaum der Nachkommen von Lisa und Bart Simpson*

...Visualisierung der Nachkommen von Lisa Simpson sowie der Nachkommen von Bart Simpson. Dabei sollen zwei Stammbäume entstehen - einer von Bart und einer von Lisa - die dann miteinander verglichen werden können. Zuerst kommen Lisa und Bart, dann deren Kinder, ihre Enkel, etc. (mind 4 Generationen). Da es noch keine Nachkommen gibt, können diese frei erfunden werden.

Die Visualisierung soll folgende Informationen darstellen:

- Verwandtschaftsverhältnisse (zumindest Eltern-Kinder),

- Unterscheidung zwischen Blutsverwandtschaft und angeheirateten Familienmitgliedern,

- Geburts- und Todestag sowie Lebensdauer von allen Familienmitgliedern,

- wichtige Ereignisse im Leben jedes Familienmitglieds (z.B., Anzeigen, Gefängnisaufenthalte, Schulzeit, Studienzeit, Nobelpreise, Arbeitslosigkeit etc.)

- Zufriedenheit jedes Familienmitglieds (Skala: sehr niedrig - niedrig - mittel - hoch - sehr hoch); kann sich im Laufe des Lebens ändern.

Die Visualisierung soll die interaktive Auseinandersetzung mit den Daten ermöglichen. Verpflichtend: Möglichkeiten zum besseren Vergleich von einzelnen Abschnitten der Stammbäume bzw. Vergleich von Ausschnitten aus Lisas und Barts Stammbäumen. + mind. 2 weitere Interaktionsmöglichkeiten (z.B., Details on Demand, Filteroptionen)

Allgemein:

- Die Daten sollen zur Analyse von Zusammenhängen zwischen Familienverhältnissen, wichtigen Ereignissen und Zufriedenheit visualisiert werden (die Anwendungsgebiets- und Zielgruppenanalyse kann kurz gehalten werden).

- Die bisher erlernten Design-Prinzipien sollen umgesetzt werden z.B.: Optimierung der Data-ink ratio (keine Comics!), visuelle Attribute (Größe, Farbe, Position, etc.) sollen sinnvoll eingesetzt werden (Information darstellen).

- Die Mockups sollten zumindest 1) die beiden Stammbäume im Überblick und 2) eine detaillierte Vergleichsansicht von 2 Teil-Stammbäumen wiedergeben.

- Alle nicht angeführten Daten können frei erfunden werden.


Description of application area, data, target group and tasks[edit]

Application area and data[edit]

Family tree analysis is used to find out more about ancestors. The graph (tree) shows the connections between ancestors and the tree’s nodes give access to more detailed information about a certain ancestor (e.g. date of birth, occupations, …). The most important data used to visualize the family structure are date of birth and date of death of a person. Additional nominal data like name of husband/wife and children (may also be represented by connections to according tree nodes), occupations and other important events in life.

Target group[edit]

Target group for family trees are usually people, who would like to know more about their ancestors. The tree is seldom created by these people themselves, but by experts. Hence a visualization has to be applicable for users, who seek for information and people, who create these graphs.

Goals[edit]

  • The graph needs to be as simple as possible to be useful for most people and still contain all information needed.
  • The chosen visualization shouldn’t distract people from the most important data shown, which should be accessible as easy as possible.

DXPqW3 <a href="http://xkrbvqjmmmoy.com/">xkrbvqjmmmoy</a>, [url=http://ugplszcaixoo.com/]ugplszcaixoo[/url], [link=http://huttibtprviz.com/]huttibtprviz[/link], http://xkvhmvyvikha.com/

Mockups[edit]

For description click on the images

Old images:
Gr03_04_1.jpg
Gr03_04_2.jpg
Gr03_04_3.jpg
Gr03_04_4.jpg

Links[edit]