Teaching:TUW - UE InfoVis WS 2008/09 - Gruppe 09 - Aufgabe 3
Aufgabenstellung
Zu beurteilende Grafik
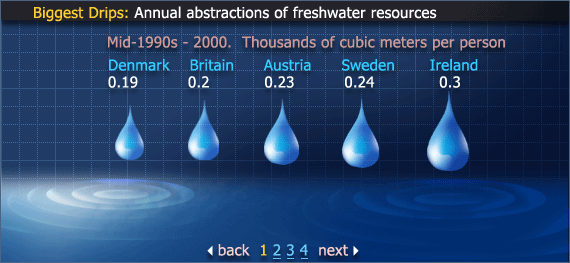
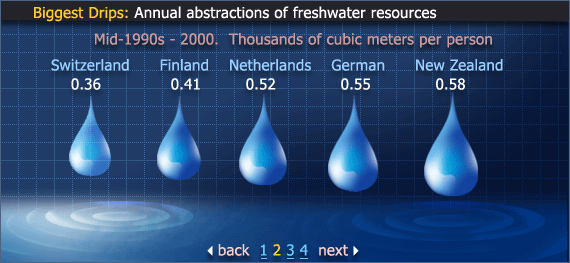
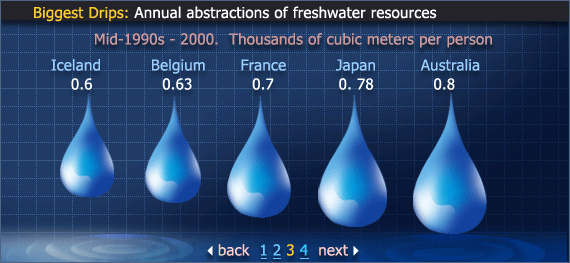
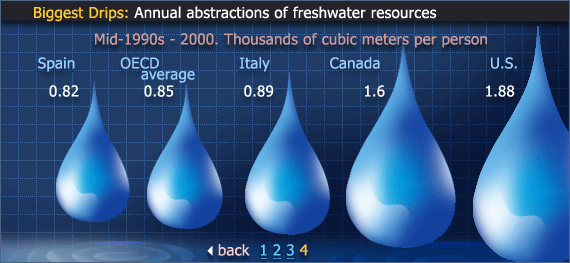
Biggest Drips: Annual abstraction of treshwater resources
Critics on the Graphics
- Bad Design
- More details
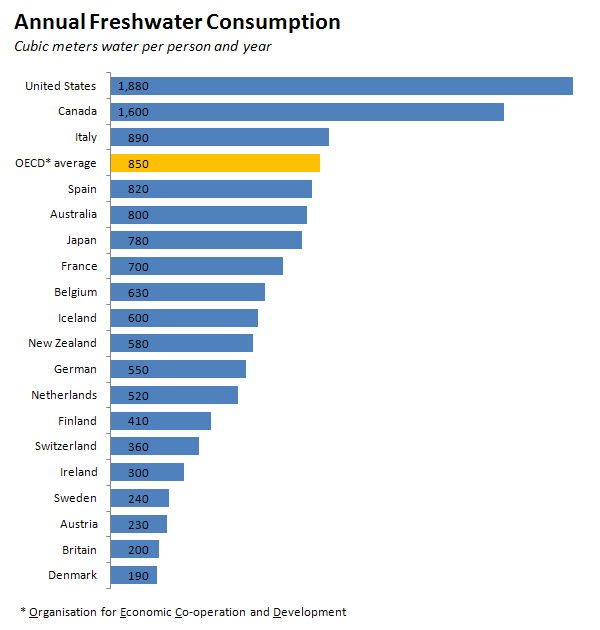
Optimized Graphics
Improvements
- New Design
- More details
References
- [Few, 2004a]:Stephen Few, Show Me the Numbers: Designing Tables and Graphs to Enlighten, Analytics Press, 2004, Chapter 7 - General Design for Communication.
- [Few, 2004b]:Stephen Few, Elegance Through Simplicity, intelligent enterprise, Oct 16, 2004.
- [Tufte, 1999]:Edward R. Tufte, The Visual Display of Quantitative Information, Stanford, January 26, 1999.
