Teaching:TUW - UE InfoVis WS 2008/09 - Gruppe 08 - Aufgabe 1 - Chart: Difference between revisions
Jump to navigation
Jump to search
No edit summary |
(Adding content inside "Types of Charts" and inserting sample pictures of charts) |
||
| Line 4: | Line 4: | ||
---- | ---- | ||
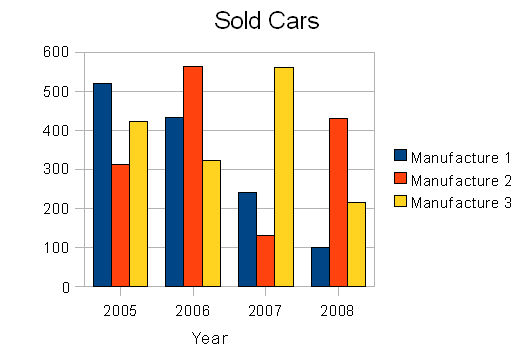
[[image:barchart.png|thumb|Sample of a bar chart.]] | |||
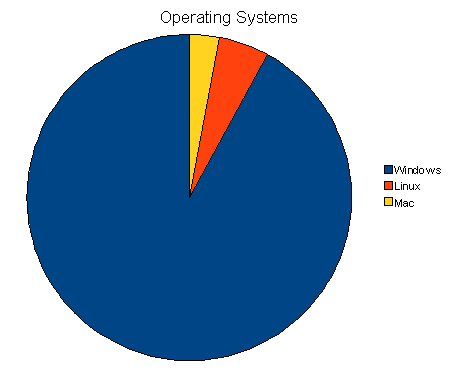
[[image:piechart.png|thumb|Distribution of different Operating Systems on Desktop PCs displayed as a pie chart.]] | |||
==Types of Charts== | ==Types of Charts== | ||
A wide range of different types of charts exist nowadays. Some of the most comon are liste below and explained in more detail. | |||
* Bar Chart | |||
* Line Chart | |||
* Pie Chart | |||
* Scatter Plott | |||
Some other types of charts are: Timeline chart, Organizational chart, Tree chart, Flow chart, Bubble chart, Radar chart. | |||
---- | ---- | ||
| Line 14: | Line 20: | ||
* [ | * [Wiki 2008] Chart, Wikipedia. Retrieved at: November 02, 2008. [http://en.wikipedia.org/wiki/Chart http://en.wikipedia.org/wiki/Chart] | ||
---- | ---- | ||
Revision as of 22:55, 2 November 2008
Definitions
A chart is a visual representation of data, in which the data are represented by symbols such as bars in a bar chart or lines in a line chart. A chart can represent tabular numeric data, functions or some kinds of qualitative structures..
[Wikipedia]


Types of Charts
A wide range of different types of charts exist nowadays. Some of the most comon are liste below and explained in more detail.
- Bar Chart
- Line Chart
- Pie Chart
- Scatter Plott
Some other types of charts are: Timeline chart, Organizational chart, Tree chart, Flow chart, Bubble chart, Radar chart.
References
- [Wiki 2008] Chart, Wikipedia. Retrieved at: November 02, 2008. http://en.wikipedia.org/wiki/Chart