Teaching:TUW - UE InfoVis WS 2008/09 - Gruppe 06 - Aufgabe 1 - Treemap: Difference between revisions
No edit summary |
No edit summary |
||
| Line 2: | Line 2: | ||
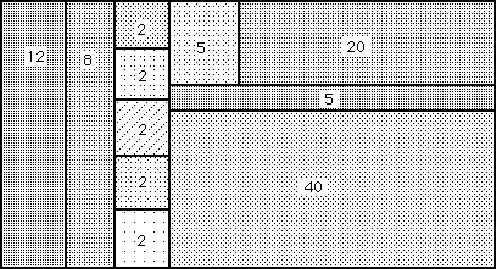
[[Image:Shneiderman 1992 treemap.png|thumb|300px|Figure 2: Same tree as Treemap [Shneiderman, 1992]]] | [[Image:Shneiderman 1992 treemap.png|thumb|300px|Figure 2: Same tree as Treemap [Shneiderman, 1992]]] | ||
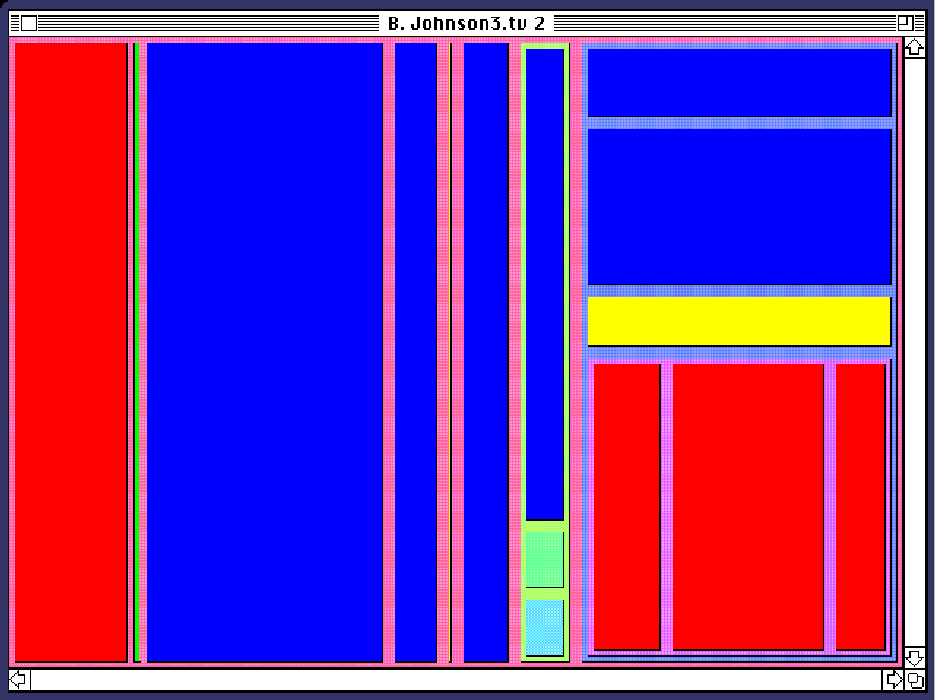
[[Image:Shneiderman 1992 treemap colour.png|thumb|300px|Figure 3: Colour-coded Treemap [Shneiderman, 1992]]] | [[Image:Shneiderman 1992 treemap colour.png|thumb|300px|Figure 3: Colour-coded Treemap [Shneiderman, 1992]]] | ||
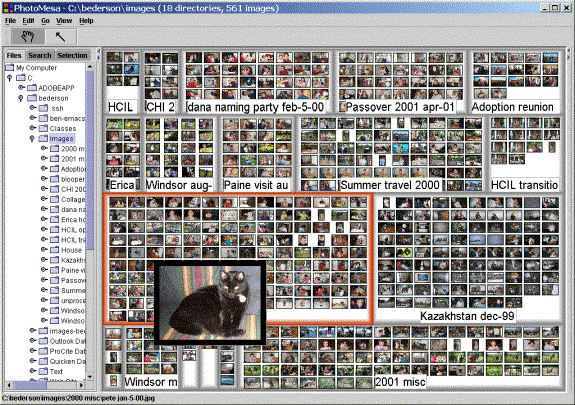
[[Image:Bederson 2002 treemap photo.gif|thumb|300px|Figure 4: Treemap for Images: PhotoMesa [ | [[Image:Bederson 2002 treemap photo.gif|thumb|300px|Figure 4: Treemap for Images: PhotoMesa [Benderson et al., 2002]]] | ||
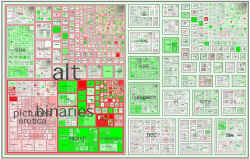
[[Image:Smith 2001 treemap usenet.jpg|thumb|300px|Figure 5: Treemap of the Usenet [Smith, 2001]]] | [[Image:Smith 2001 treemap usenet.jpg|thumb|300px|Figure 5: Treemap of the Usenet [Smith and Fiore, 2001]]] | ||
{{Definition|Treemaps are a 2D space-filling visualisation method for hierarchical, tree like structures.<br/> They were introduced by Shneiderman [1992].}} | {{Definition|Treemaps are a 2D space-filling visualisation method for hierarchical, tree like structures.<br/> They were introduced by Ben Shneiderman [1992].}} | ||
Treemaps aim at visualising a certain attribute of hierarchically structured data in a 2D space, for example the size of files in various levels of folder hierarchies on a hard-disk (which was the motivation for developing Tremaps in [Shneiderman 1992]). | Treemaps aim at visualising a certain attribute of hierarchically structured data in a 2D space, for example the size of files in various levels of folder hierarchies on a hard-disk (which was the motivation for developing Tremaps in [Shneiderman, 1992]). The traditional ways of visualising hierarchical structures like (directed) graphs, as in Figure 1, can show relations between the nodes, but fail to visualize attributes such as size or importance of nodes. Treemaps try to overcome this by visualising each node as a small rectangle in the 2D space, whose size represents the node's importance, as in Figure 2. | ||
| Line 21: | Line 21: | ||
The Treemap method has been well studied, and a wealth of variations of the original algorithms have been published (compare [Shneiderman 1998]), among them: | The Treemap method has been well studied, and a wealth of variations of the original algorithms have been published (compare [Shneiderman, 1998]), among them: | ||
* Squarified Treemaps try to render the shapes of nodes rather as squares than as (long and narrow) rectangles, which are difficult to compare. To achieve this, the order of the nodes is disregarded. Squarified Treemaps may lead to stability issues when node sizes change, causing the order of nodes to potentially change dramatically ([Benderson 2002]). | * Squarified Treemaps try to render the shapes of nodes rather as squares than as (long and narrow) rectangles, which are difficult to compare. To achieve this, the order of the nodes is disregarded. Squarified Treemaps may lead to stability issues when node sizes change, causing the order of nodes to potentially change dramatically ([Benderson et al., 2002]). | ||
* An attempt to overcome the stability issue is presented in [Shneiderman 2001] by balancing order and visual appeal of squared slices. | * An attempt to overcome the stability issue is presented in [Shneiderman and Wattenberg, 2001] by balancing order and visual appeal of squared slices. | ||
Applications of Treemaps include: | Applications of Treemaps include: | ||
*Visualisation of File-system usage [Shneiderman 1992] | *Visualisation of File-system usage [Shneiderman, 1992] | ||
*A photo image browser, where the issue of having to display fixed-size content (the images) in shapes with potentially very differently aspect ratios [Benderson 2002] | *A photo image browser, where the issue of having to display fixed-size content (the images) in shapes with potentially very differently aspect ratios [Benderson et al., 2002] | ||
*A visualisation of the newsgroups in Usenet, and the frequency of specific types of newsgroups [Smith 2001] | *A visualisation of the newsgroups in Usenet, and the frequency of specific types of newsgroups [Smith and Fiore, 2001] | ||
| Line 35: | Line 35: | ||
*[Shneiderman, 1992] Ben Shneiderman. Tree visualization with tree-maps: A 2-D space-filling approach. ''ACM Transactions on Graphics'', 11(1):92-99, 1992. | *[Shneiderman, 1992] Ben Shneiderman. Tree visualization with tree-maps: A 2-D space-filling approach. ''ACM Transactions on Graphics'', 11(1):92-99, 1992. | ||
*[Shneiderman, 1998] Ben Shneiderman. Treemaps for space-constrained visualization of hierarchies. Created | *[Shneiderman, 1998] Ben Shneiderman. Treemaps for space-constrained visualization of hierarchies. Created at December 26, 1998. Retrieved at: November 5, 2008. http://www.cs.umd.edu/hcil/treemap-history/ . | ||
*[Shneiderman, 2001] Ben Shneiderman | *[Shneiderman and Wattenberg, 2001] Ben Shneiderman and Martin Wattenberg. Ordered treemap layouts. In ''Proceedings of the IEEE Symposium on Information Visualization 2001 (INFOVIS 2001)'', pages 73 - 78, 2001, IEEE. | ||
*[Benderson, 2002] Benjamin B. Bederson, Ben Shneiderman, | *[Benderson et al., 2002] Benjamin B. Bederson, Ben Shneiderman, and Martin Wattenberg. Ordered and quantum treemaps: Making effective use of 2D space to display hierarchies. ''ACM Transactions on Graphics'', 21(4):833-854, October 2002. | ||
*[Smith 2001] Marc Smith and Andrew Fiore. Visualization components for persistent conversations. In ''Proceedings of the Conference on Human Factors in Computing Systems'', pp 136-143. Seattle, Washington, United States, 2001 | *[Smith and Fiore, 2001] Marc Smith and Andrew Fiore. Visualization components for persistent conversations. In ''Proceedings of the Conference on Human Factors in Computing Systems'', pp 136-143. Seattle, Washington, United States, 2001, ACM. | ||
Revision as of 21:08, 7 November 2008
They were introduced by Ben Shneiderman [1992].
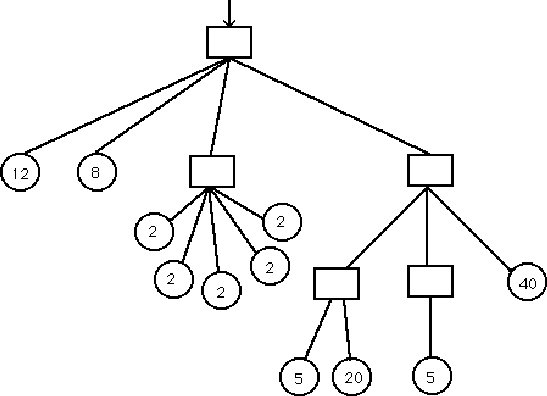
Treemaps aim at visualising a certain attribute of hierarchically structured data in a 2D space, for example the size of files in various levels of folder hierarchies on a hard-disk (which was the motivation for developing Tremaps in [Shneiderman, 1992]). The traditional ways of visualising hierarchical structures like (directed) graphs, as in Figure 1, can show relations between the nodes, but fail to visualize attributes such as size or importance of nodes. Treemaps try to overcome this by visualising each node as a small rectangle in the 2D space, whose size represents the node's importance, as in Figure 2.
In detail, the Treemap algorithm has the following properties
- Input: a root node, and a 2D space.
- The number of outgoings edge from the root node determines the number of partitions in the space.
- The sum of weights assigned to each sub-tree determines the size of the partitions.
- Then, recursively the space assigned to each sub-tree will be partitioned.
- The sub-tree are partitioned alternatively horizontally and vertically, with odd levels being horizontally, and even vertically.
- Additional attributes can be visualised with a colour coding (e.g. file-types as in Figure 3).
This algorithm was named "slice and dice".
The Treemap method has been well studied, and a wealth of variations of the original algorithms have been published (compare [Shneiderman, 1998]), among them:
- Squarified Treemaps try to render the shapes of nodes rather as squares than as (long and narrow) rectangles, which are difficult to compare. To achieve this, the order of the nodes is disregarded. Squarified Treemaps may lead to stability issues when node sizes change, causing the order of nodes to potentially change dramatically ([Benderson et al., 2002]).
- An attempt to overcome the stability issue is presented in [Shneiderman and Wattenberg, 2001] by balancing order and visual appeal of squared slices.
Applications of Treemaps include:
- Visualisation of File-system usage [Shneiderman, 1992]
- A photo image browser, where the issue of having to display fixed-size content (the images) in shapes with potentially very differently aspect ratios [Benderson et al., 2002]
- A visualisation of the newsgroups in Usenet, and the frequency of specific types of newsgroups [Smith and Fiore, 2001]
References
- [Shneiderman, 1992] Ben Shneiderman. Tree visualization with tree-maps: A 2-D space-filling approach. ACM Transactions on Graphics, 11(1):92-99, 1992.
- [Shneiderman, 1998] Ben Shneiderman. Treemaps for space-constrained visualization of hierarchies. Created at December 26, 1998. Retrieved at: November 5, 2008. http://www.cs.umd.edu/hcil/treemap-history/ .
- [Shneiderman and Wattenberg, 2001] Ben Shneiderman and Martin Wattenberg. Ordered treemap layouts. In Proceedings of the IEEE Symposium on Information Visualization 2001 (INFOVIS 2001), pages 73 - 78, 2001, IEEE.
- [Benderson et al., 2002] Benjamin B. Bederson, Ben Shneiderman, and Martin Wattenberg. Ordered and quantum treemaps: Making effective use of 2D space to display hierarchies. ACM Transactions on Graphics, 21(4):833-854, October 2002.
- [Smith and Fiore, 2001] Marc Smith and Andrew Fiore. Visualization components for persistent conversations. In Proceedings of the Conference on Human Factors in Computing Systems, pp 136-143. Seattle, Washington, United States, 2001, ACM.