Teaching:TUW - UE InfoVis WS 2008/09 - Gruppe 01 - Aufgabe 4
Aufgabenstellung[edit]
Gegebene Daten[edit]
Homer Simpson's Trinkverhalten in Abhängigkeit von seinen Lebensumständen
...Visualisierung von Homer's Lebensabschnitten bzw. Ereignissen mit Einfluss auf sein
Trinkverhalten (zB.: Kindheit, Pubertät, Arbeitslosigkeit, Beziehungen, Hochzeit, Geburt
der Kinder, Liebeskummer, Alltag, etc.) von seiner Geburt bis Jetzt + mögliche
Zukunftsszenarien (mind. 3).
- Die Menge folgender Getränke soll für die jeweiligen Lebensumstände ablesbar sein
(ml oder Liter - je nachdem - pro Tag, Monat, Jahr (z.B.: Fokus+Kontext Methoden):
 a) Wasser

 b) Milch

 c) Fruchtsaft

 d) Cola

 e) Kaffee (Würfelzucker?)

 f) Bier
(vereinfacht angenommen, Homer trinkt ausschließlich diese Getränke)
- Die folgenden Werte sollen abhängig von den konsumierten Getränken ablesbar sein:
 1) g oder kg konsumierter Zucker (aus Getränken) + empfohlene Maximaldosis pro Tag, Monat, Jahr
   (empfohlene Maximaldosis/Tag: 50g; enthaltener Zucker: 10g/100 ml Cola; 10g/100 ml Fruchtsaft; 3g/Würfelzucker).

 2) mg konsumiertes Coffein + empfohlene Maximaldosis pro Tag, Monat, Jahr
   (empfohlene Maximaldosis/Tag: 600mg; enthaltenes Coffein: 10 mg/100 ml Cola; 80 mg/100 ml Kaffee).

 3) g konsumierter Alkohol + empfohlene Maximaldosis pro Tag, Monat, Jahr
   (empfohlene Maximaldosis/Tag: 20g; enthaltener Alkohol: 3,6 g/100ml Bier)
- Die Daten sollen zur medizinischen/psychologischen Analyse visualisiert werden.
- Die bisher erlernten Design-Prinzipien sollen umgesetzt werden (z.B.: Optimierung der Data-ink ratio).
- Die Mockups sollten zumindest 1) Homer's Leben im Überblick 2) und eine Detailansicht wiedergeben.
- Alle nicht angeführten Daten können frei erfunden werden.
Description of the application area, data, users and goals[edit]
Application area[edit]
The data shown in the following parts of this work descripe medical data (health and psycholocical) of a single person. Our visualisation should show how the drinking behaviour is inflecting homers life. Because it should be used for a medical analysis it must be precise on the one side (for doctors, experts, ...) and easy to understand on the other side (sick people). It determines not only the behaviour all over his lifetime but also shows us some special events in his life (childhood, adolescence, unemployment, connections, marriage, birth of his children, lovesickness, allday, ...). With these special events visualized medical experts can find out why homer has his drinking problem.
Data[edit]
For the visualisation of these different effects of drinking in all life circumstances we are displaying the ingredients of them. The three ingredients we check are:
- sugar
 maximum dosage per day : 50 g
 description: Excessive consumption of sugar has been associated with increased incidences of type 2 diabetes, obesity and tooth decay.
 further informations: http://en.wikipedia.org/wiki/Sugar
- coffeine
 maximum dosage per day : 600 mg
 description: Caffeine is a bitter white crystalline xanthine that acts as a psychoactive stimulant drug and a mild diuretic in humans and other animals.
 further informations: http://en.wikipedia.org/wiki/Coffein
- alcohol
 maximum dosage per day : 20 g
 description: Alcohol intoxication affects the brain, causing slurred speech, clumsiness, and delayed reflexes (drunkenness). Chronic effects include effects of in the liver, brain and addiction.
 further informations: http://en.wikipedia.org/wiki/Alcohol
 further informations: http://en.wikipedia.org/wiki/Alcoholic_beverage
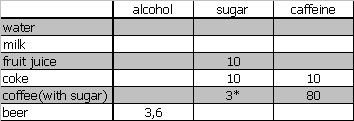
The six drinks (milk, beer, water, wine, coke, coffee) we are checking contain these 3 ingredients as followed:
Ingredients in g/100 ml, sugar added extra to coffee (*).
The maximum dosage of them are:
- sugar: 50 g
- coffeine: 600 mg
- alcohol: 20 g
Users[edit]
- Homer Simpson
- Moe
- Medical experts
- Psychologist
Users of our application should be Homer Simpson on the one side (with it he can see how problems in his life affect his alcohol consum) and on the other side our visualisation should be used by medical experts and psychologist to help him solve this problems.
Goals[edit]
Our visualisation should show the drinking behaviour in homers life with some special points (problems). Further it will show us the maximum consument values per day for the descripted ingredients and how homer crosses this line.
Concept[edit]
Graph with linked in hierarchical list[edit]
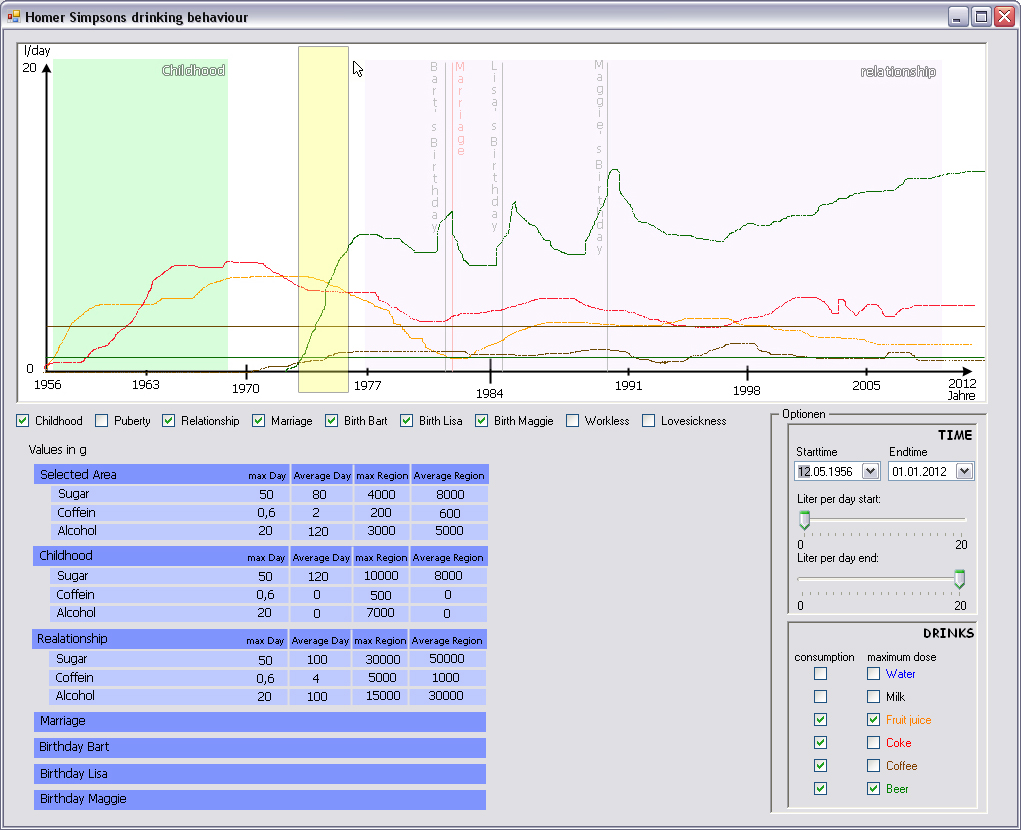
We decided to show the result in two visualization. The first part is a dynamic graph. The main message of it is the drinking behaviour in liter per day over the life of Homer Simpson. It includes the different types of drinks (water, coke, coffee, beer,...) and the maxium dose of sugar, alcohol or coffein which should be consumend. Further are some links and regions in this graph. The regions descripe longer events in homers life like his relationship with marge or his childhood and links discripe day events like the birthday of bart or his marriage with marge. The second part is a hierarchical list which is linked with the graph above. There everybody can check the selected values and compare them with important time-regions of homers life. The third part of our application is a options part were the behaviour of the graph can be influenced.
Graph[edit]
In the graph view we can see how the drinking behaviour changes in Homers life. The lines descripe how much of the drink the color depends to Homer consument on this day. With the options box on the bottom-right of the application every drink can be enabeled in the view or can be hiden. Further an option to see the maxium consumed sugar, coffein or alcohol per selected drink has been integrated. With the checkboxes under the graph some different events in Homers life can be enabled in the scene. There are two different types of events:
- Region
A region is a longer part of Homers life like his childhood or his relationsship to marge. These are represented in the graph as a nearly transparent color bar in an unique color for every event.
- Day Events
Day events are for example the marriage of Homer and Marge or the Birthday of Bart or Lisa. An other part of the options box is the time-area in which the graph is displayed and the detail in drinking volumes. With this two options it is possible to analyse every small part of homers life.
To analyse the events in this graph there is the possibility to select a specific region in the graph. With a mouse click in the graph the region start is selected an with another click on another point the endpoint will be fixed for the hierarchical list.
Hierarchical list[edit]
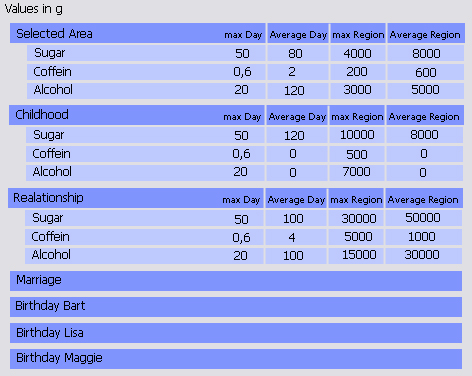
In the hierarchical list there are two parts for a deeper analysis of our data. The first one is the dynamic part which is activated when the user has selected a region in the graph. The other part is the static list which contains the important life times of homer like his relationsship or his childhood. In the detail view of the list the user of our application can see details for the groups sugar, coffein and alcohol. There he sees the maximum values of for example sugar which homer should consume on one day and beside this the average value per day homer has really consumed in this time region. Further everybody can see the data calculated for the howle selected region. The single parts of the hierarchical list can be opened and closed so we can compare the values we want. Further the categories can be rearanged for a better view on it.
How to use it[edit]
Our application is easy to use for experts and for normal people. Experts can use both visualisation the get detailed information about homer. They can select exact regions in the graph and so it is easy to analyse when homer has the biggest problem with his drinking. Normal people can see in the graph that Homers drinking consum is higher when a special event happens. With the pre defined selections in the hierarchical view the can easy compare this values with a free selected region.
Pro / Contra[edit]
pro
- all data is in one screen
- data can be selected very easy
- regions can be taken from a whole life down to a single day
- important events in homers life are always visible and can be compared very easily
- the graph is easy to understand for "normal" people
- experts can get exact data from the hierarchical list
contra
- not all data is in one graph
- one data is graphical and one in numbers


