Teaching:TUW - UE InfoVis WS 2007/08 - Gruppe 07 - Aufgabe 3
Assignment description
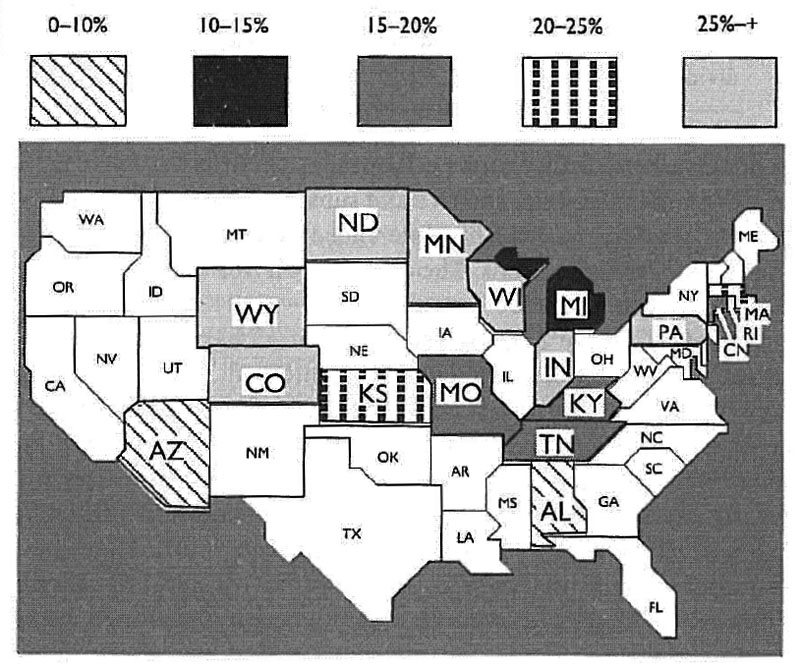
Assigned Graphic
 Established Percentage of Homes that Exceed EPA's Recommended Level for Radon
Used terminology
In this section, we will try to explain several terms used through the rest of the article.
- Data-ink - Data-Ink is a ratio that specifies how much of the visual presentation in a graphic really describes some concrete data. The equation looks something like this: data-ink / all-ink = data-ink-ration. The value of the data-ink ratio always lies between 1 and 0, the bigger the number, the better.