Teaching:TUW - UE InfoVis WS 2007/08 - Gruppe 06 - Aufgabe 1 - Thematic Map: Difference between revisions
No edit summary |
No edit summary |
||
| Line 1: | Line 1: | ||
=== Defintion === | === Defintion === | ||
In following domains for example, thematic maps are used: administation, scheduling, environment, education, science, public relations, transport & tourismn, documentation, national defense, or mass media. | |||
=== Methods === | === Methods === | ||
Revision as of 19:32, 2 December 2007
Defintion
In following domains for example, thematic maps are used: administation, scheduling, environment, education, science, public relations, transport & tourismn, documentation, national defense, or mass media.
Methods
The most important methods for designing a thematic map are:
- Choropleth
- Proportional Symbol
- Isolines
- Dot
- Dasymetric
Choropleth
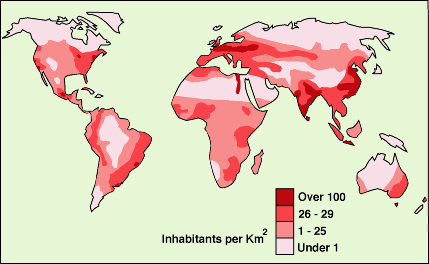
Choropleth maps are the most common thematic maps. A choropleth map displays statistical data, which is colored or patterned accordingly to their distribution. It provides an easy way to demonstrate how data is shared across a geographic area, e.g. population density. Typically they are used after elections to show the spreading of the votes.
Proportional Symbol
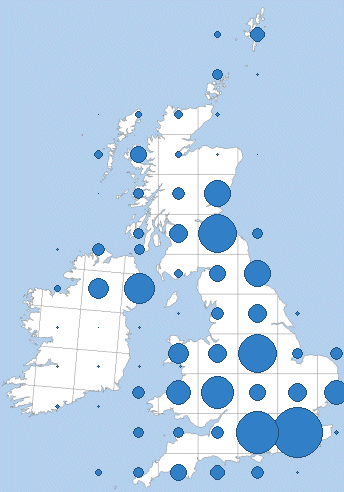
Proportional Symbols maps represent data associated with point locations. Interpretations of statistics represented by these maps are simple to understand. The Proportional Symbols vary in size from place to place on a map in proportion to the quantities they represents.
Isolines
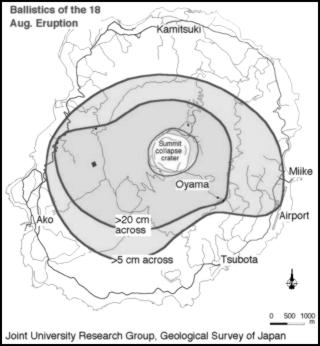
An Isoline map uses contour lines to join points where a function has a same particular value and thus show valleys and hills, and the steepness of slopes. Contour lines are curved or straight lines on a map describing the intersection of a real or hypothetical surface with one or more horizontal planes.
Dot
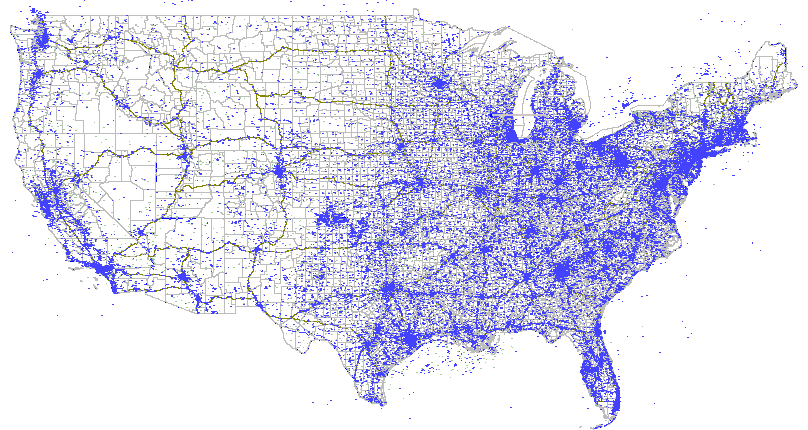
These maps use dots to show the presence of a feature or occurrence and display a spatial pattern. A dot is not necessarily required to represent a single unit and may indicate any number of entities.
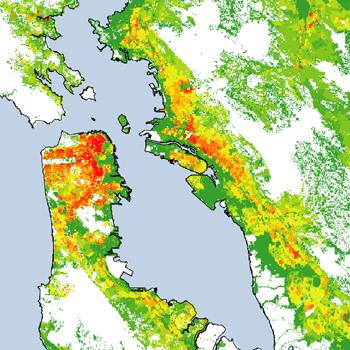
Dasymetric
Dasymetric maps utilize areal symbols to spatially classify volumetric data. However, although boundaries are displayed on dasymetric maps, these geographic units may span multiple theme values.
References
[Ross] Zev Ross, ZevRoss Spatial Analysis. Retrieved at: November 8, 2007. http://www.zevross.com/special/history/halley.gif.
[Answers.com] John Snow. Retrieved at: November 8, 2007. http://www.answers.com/topic/john-snow-physician
[bbc.co.uk] BBC – Education Scotland – Standard Grade Bitesize. Retrieved at: November 8, 2007. http://www.bbc.co.uk/scotland/education/bitesize/standard/geography/population/distribution_density_rev3.shtml
[forums.nbn.org.uk] Joint Nature Conservation Committee. Retrieved at: November 8, 2007. http://forums.nbn.org.uk/recreport/index.php?id=5
[www.volcano.si.edu] Global Volcanism Program. Retrieved at: November 8, 2007. http://www.volcano.si.edu/world/volcano.cfm?vnum=0804-04=&volpage=var
[Dodge] Martin Dodge, An Atlas of Cyberspaces. Retrieved at: November 8, 2007.
http://www.cybergeography.org/atlas/tower_maps_large.gif
[www.usgs.gov] Population Density of the San Francisco Bay Area. Retrieved at: November 8, 2007.
http://geography.wr.usgs.gov/science/dasymetric/images/zoom2_lowres.jpg
[en.wikipdedia.org] Thematic map. Retrieved at: November 8, 2007. http://en.wikipedia.org/wiki/Thematic_map
[Dr. Michael P. Peterson] THEMATIC MAPS. University of Nebraska at Omaha. Retrieved at: November 8, 2007. http://maps.unomaha.edu/Peterson/carta/Notes/THEMMAP.html
[www.gigawiz.com] Thematic Maps and Map Projection Utilities. Retrieved at: November 8, 2007. http://www.gigawiz.com/thematic.html
[Jeffrey J Hemphill] Proportional Symbol Maps with ArcGIS. Retrieved at: November 8, 2007. http://www.geog.ucsb.edu/~jeff/gis/proportional_symbols.html
[Scott Freundschuh] Course Map Design. UNIVERSITY OF MINNESOTA DULUTH. Retrieved at: November 8, 2007.http://www.d.umn.edu/geog/cartfolder/HTML%20Pages/Map-Types.htm