Teaching:TUW - UE InfoVis WS 2007/08 - Gruppe 05 - Aufgabe 1 - Generalization: Difference between revisions
No edit summary |
No edit summary |
||
| Line 33: | Line 33: | ||
== Examples == | == Examples == | ||
[[Image:Gr05_uebung1_generalization_01.png]] | [[Image:Gr05_uebung1_generalization_01.png]] | ||
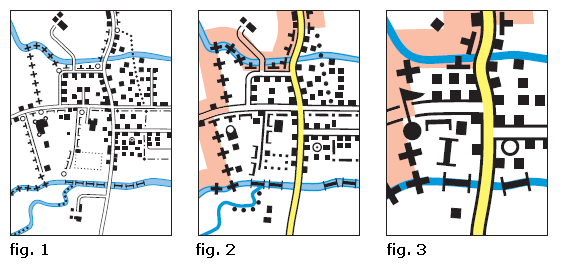
All 3 figures show the same segment of the map | |||
Figure 1 shows the most details. The shapes of the buildings are not simplified yet. This map doesn´t show the main-street. | |||
Figure 2 shows with the color yellow the main-street. The shapes of the building are simplified (only rectangles are shown). The quantity of the buildings is not equal with the “real” quantity. | |||
Figure 3 doesn´t show details like some streets or the little river on the bottom-left side. The building in the middle is now presented with a flag. This visualization doesn´t represent the reality, but it increases the important of the building | |||
Revision as of 17:33, 3 November 2007
Generalization
Generalization is the abstraction of aspects of the reality, which is important for a special kind if question. A field of use is the visualization of maps.
Definition
A. Hettner defines Generalization as
„… a selection of the most important, the essence and the target-oriented simplification. In this process, it is important that the map shows the most important, characteristically attributes, which are needed for the use, the topic and the scale of the map.“
Overview
It depends on the scale, which information can be shown on a map. The designer of a printed map can decide, which information is shown (i.e. toponyomies, name of the streets, rivers…) and on which position within the map this information should be placed. But digital maps aren´t produced in traditional way. Users can zoom within these maps. It depends on the zoom-factor, which information is shown. The computer has to decide, which information is shown on which position. For this procedure algorithms are needed.
Goals of generalization
- Improve the message of the map
- Improve the communication of the content of the map
- Improve the speed of the collection of data
- Help to find answers on questions
- The shown information should be useful for the target-audience (i.e. maps for traffic-engineers, city-engineers, environment-engineers…)
When should be generalized?
- If a map has too much information. Then it´s hard to understand the information (i.e. different symbols, Overlapping of symbols, colors…)
- If a map is designed only for a special audience and only a special conclusion is needed
- If information could be combined
- If maps lose their character because there are too much of information
- If important information is unnoticed
- If objects are too small, if they are shown in „correct“ scale
Kinds of generalization?
- Simplifications (i.e. defines of shapes)
- Straighten (i.e. curve)
- Aggregation (i.e. arrangement of objects)
- Combination (z. B. important information overlap less important information)
- Union (i.e. many objects are combined to one)
- Change the symbols (i.e. from shape-symbols to point-symbols)
Examples
All 3 figures show the same segment of the map Figure 1 shows the most details. The shapes of the buildings are not simplified yet. This map doesn´t show the main-street. Figure 2 shows with the color yellow the main-street. The shapes of the building are simplified (only rectangles are shown). The quantity of the buildings is not equal with the “real” quantity. Figure 3 doesn´t show details like some streets or the little river on the bottom-left side. The building in the middle is now presented with a flag. This visualization doesn´t represent the reality, but it increases the important of the building
