Teaching:TUW - UE InfoVis WS 2007/08 - Gruppe 02 - Aufgabe 3
Poor Graphic
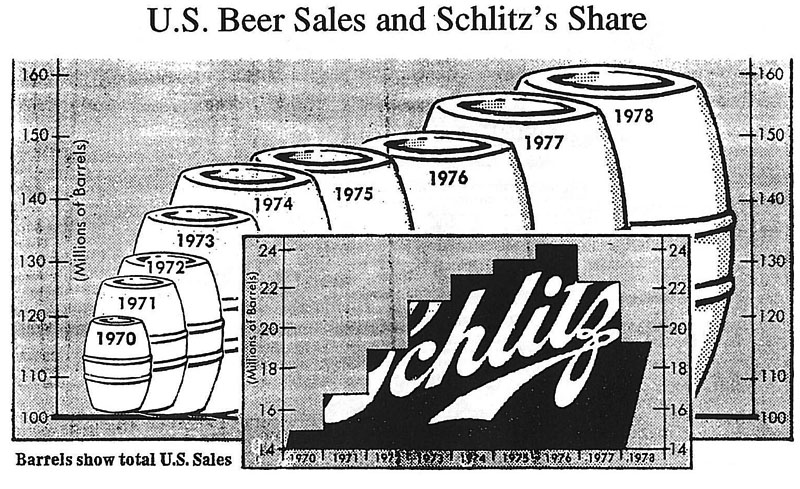
 U.S. Beer Sales and Schlitz´s Share
Critique
- Overall impression and number of tables
- As one can see, the overall graphic of "U.S. Beer Sales and Schlitz's Share" consists of two separated tables. One table describes the "U.S. Beer Sales" and remains in the back while the other one describes the "Schlitz's Share" and comes to stay in the front. This makes the overall graphic difficult to understand. In the first place it is not obvious what it should communicate. Furthermore the two tables are using different styles. The "U.S. Beer Sales" are described by the use of barrels but the "Schlitz's Share" is indicated by bars even though both tables share the same object (millions of barrels).
- Layer
- Data-Ink Ratio