Teaching:TUW - UE InfoVis WS 2007/08 - Gruppe 02 - Aufgabe 1 - Flow Visualization
What is flow visualization?
As we are human beings who live on earth, we are familiar with all the elements and forces that affect our lives constantly. Thus most of us roughly know some things about fluids too. Everyone has at least once seen how water whirls in a bathtub when it runs out or how wind blows leaves around in autumn forming kind of a small vortex. We all know pictures of a cloud formed like a mushroom after the explosion of an atomic bomb. Obviously we are acquainted with the flow of fluids though we can’t actually see many of them because they are transparent, i.e. air, water or gas. We do also know how to describe the fluid motion by mathematical equations but the problem is that these are far too difficult to be computed by humans. We can only try to solve these equations via using numerical calculators, i.e. very fast computer algorithms. But even the numerical results are only estimations and may not correspond to natural processes until they have been approved by physical experiments. So, in order to understand what is going on we need to find ways to make visible what cannot be actually perceived by the human eye.
In fact, there are several ways how to do this. Generally we can divide into two main methods:

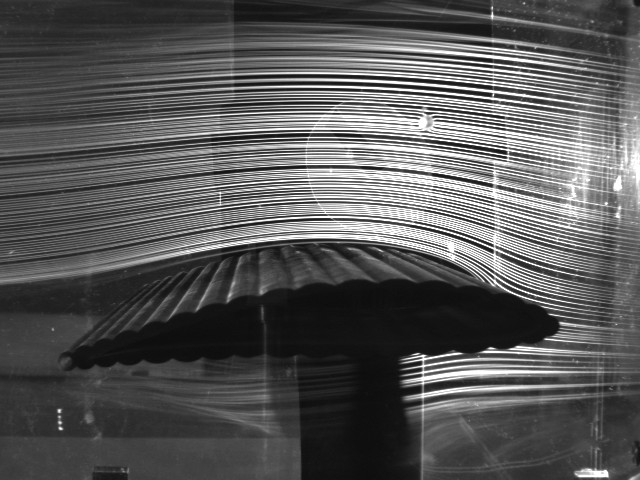
- The physical method. By the use of wind in a tunnel combined with small particles, i.e. smoke, oil, etc. one can make the motion of a fluid, i.e. air visible. The image to the right shows how such a windtunnel works. From a definite source wind is imitated by fans and directed at the airfoil. In this case small smoke particles are used to make the flow of the air visible. We can actually perceive how the air moves around the airfoil and forms vortices at the bottom and the back of it. These method is very useful in designing aircrafts and especially airfoils.

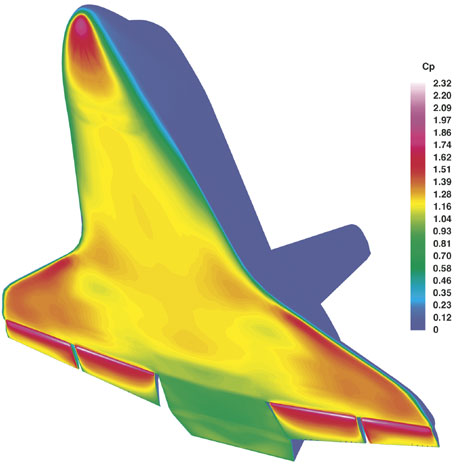
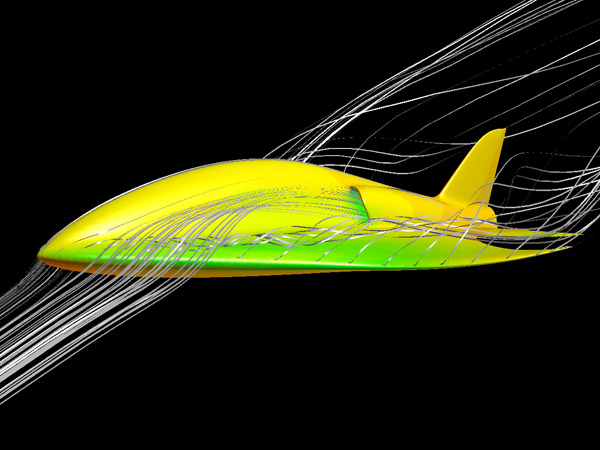
- Computational fluid dynamics. As already mentioned above, the motion of fluids as a whole can be expressed by mathematical equations which can be estimated numerically. Thus even supercomputers would take a long time to solve the equations and the solution would only be an estimation of the definite problem, more accurate methods needed to be discovered. One approach is to discretize the spatial domain into small cells so every single cell can be computed separately. Using this method one gets a mesh grid of the definite fluid motion. The image to the right shows how such a mesh grid looks like in practice. NASA is testing complex scenarios of its space shuttles like return-to-launch-site and transatlantic abort maneuvers by the use of computational fluid dynamics. The image shows the surface pressure distribution at the speed of Mach 15.

Definition
References
- [Merzkirch, 1987] Wolfgang Merzkirch. Flow Visualization, Second Edition. Academic Press Inc. Ltd., London, 1987.
- [Devenport and Hartwell, 2006] W.J. Devenport and W.L. Hartwell, Experiment 1 - Flow Visualization. Last modified at: December 20, 2006. Retrieved at: November 9, 2007. http://www.aoe.vt.edu/~devenpor/aoe3054/manual/expt1/index.html.