Teaching:TUW - UE InfoVis WS 2006/07 - Gruppe 08 - Aufgabe 1 - Bifocal Display
Definition
A bifocal display provides a detailed view of the current region of interest while providing a more compressed view of information outside that region of interest.
Context
The desire to present all the relevant information within its context usually results in an extremely cluttered and confusing display. If only the current region of interest is displayed, one has to arrange for a mechanism to quickly switch to relevant information before and after the region of interest. Even so, much of the surrounding context is lost as it's not as easily accessible. [Spence, 2006] This is known as the "focus+context" problem.
Original concept

To address this problem, Spence and Apperley proposed their bifocal display:
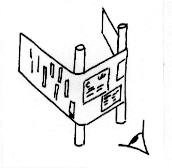
A bifocal display can be thought of as a continuous ribbon of data that is displayed on three seperate viewports or monitors (see image). The centre viewport is used to display the current region of interest while the left and right viewports are used to display the preceding and succeeding context respectively. The region of interest is displayed in great detail while the context in compressed, so as to allow one to identify objects at a cursory glance.
Most importantly, it should be easily possible to "scroll" backwards and forwards, replacing the current region of interest with content from its surrounding context, thus expanding the newly focused region of interest and relegating the former region of interest to its place in the compressed context. [Spence, 2006]
Usage

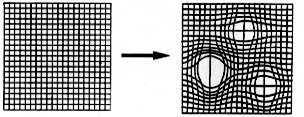
The original concept is limited to visualization problems with one main continuous dimension. If we add a second dimension we get the concept of fish-eye or magnyfing glass (see image). Both are rather applicable only in situations with continuous dimensions. This is already reflected in [Apperley et al., 1982]:
Instead of simply compressing the context visually it could prove useful to choose a different representation for the peripherial viewports than is used for the central viewport.
In many situations the context is best displayed by some sort of graph, the most common example being the filesystem-tree.
Depending on how broad the metapher of bifocal display is understood, one can see all types of applications with some sort of navigation and detail pane as applying the visualisation strategy of bifocal display.
Following the various techniques are summarized:
- continuous ribbon - "the original" but only applicable for time-lines or similar one-dimensional visualisation problems.
- fisheye view / magnyfing glass - very useful for viewing maps or plans
- tree + detail - probably the most wide-spread technique (email-client, filesystem-browser, etc)
- graph + detail - eg modeling tools which provide interactive viewports with zoomable views of a graph allowing to simply access the detailed information of its nodes or edges.
Current Examples

References
- [Spence, 2006] Bob Spence, The Acquisition of Insight. Accessed at: Oct 29, 2006, http://www.ee.ic.ac.uk/research/information/www/Bobs.html#Context
- [Apperley et al., 1982] M.D. Apperley, I. Tzavaras, R. Spence. A bifocal display technique for data presentation. Eurographics '82, p. 27. Abstract: http://diglib.eg.org/EG/DL/Conf/EG82/papers/EUROGRAPHICS_82pp027-043.pdf.abstract.pdf
Current Applications - bifocal display in practice/business:
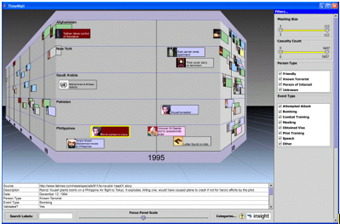
- [InxightVizServer] Inxight VizServer - corporate web-site, product section. Accessed at: Oct 30, 2006. http://www.inxight.com/products/vizserver/
- [BrainEKP] TheBrainEKP: Enterprise Knowledge Platform - corporate web-site, product section. Accessed at: Oct 30, 2006.