Teaching:TUW - UE InfoVis WS 2006/07 - Gruppe 03 - Aufgabe 2: Difference between revisions
Jump to navigation
Jump to search
m (→Visual Clutter) |
|||
| Line 33: | Line 33: | ||
==Data Density== | |||
==Chartjunk== | |||
*in the text a reason for increased hurricans is mentioned, but in the shown data is no evidence for that, because there is no reason related data. | *in the text a reason for increased hurricans is mentioned, but in the shown data is no evidence for that, because there is no reason related data. | ||
Revision as of 16:42, 12 November 2006
Poor Graphic

Arguments why it is a poor graphic
Principles of Graphical Integrity
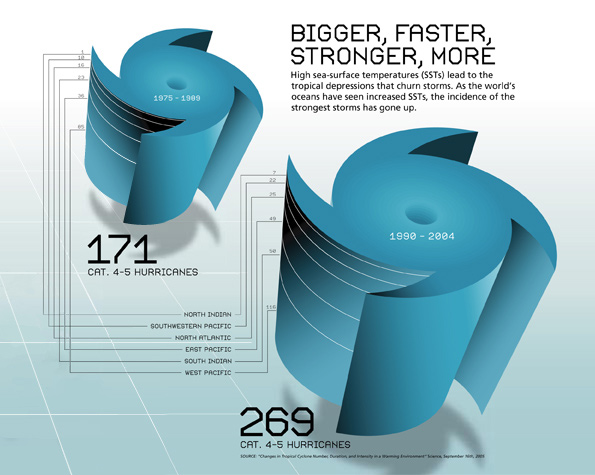
- Lie Factor: The right graphic seems do be much larger then the left. It should be only 1,5 times larger then the other one based on the data. The size of the effect in data is 5,7% and the effect in the graphic about 1,55%, which results a high Lie Factor of 2,97.(BIN MIR NICHT SICHER) Its Lie Factor should have a value between 0.95 and 1.05. [Friendly, 2005]
- the numbers are not readable and the lines between the numbers are not needed and very irritating.
- a pseudo 3-dimensional graphic is used to show 1-dimensional data
Data-Ink Ratio
This graph has a low Data-Ink Ratio. To maximise the data-ink ratio we have to reduce the non-data ink and enhance the data ink.
How much of the ink could be removed without loss of information?
- A large share of ink is used to show the pseudo 3-dimensional graphic.
- The white lines forming squares (left) do not contain additional information.
- It's not necessary to wirte two times "CAT. 4-5 Hurricanes".
Missing ink
- The ink don't change as the data change.
Visual Clutter
Data Density
Chartjunk
- in the text a reason for increased hurricans is mentioned, but in the shown data is no evidence for that, because there is no reason related data.
improved graphic
description of improvements
References
[Friendly, 2005] Michael Friendly, The Lie Factor, Department of Mathematics and Statistics, Toronto, Last updated: February 23, 2002, Retrieved at: Nov 17, 2006, http://www.math.yorku.ca/SCS/Gallery/lie-factor.html