Teaching:TUW - UE InfoVis WS 2006/07 - Gruppe 03 - Aufgabe 1 - Data Density: Difference between revisions
m (→Example) |
|||
| Line 13: | Line 13: | ||
== Example == | == Example == | ||
To better undrestand this term, we show two two graphs and compute their data density. Consider the result of a survey in which the gender, height and weight were recordet for 92 students. Below you see a bar graph showing the breakdown into males and females. The charts are 5.6cm by 7.4cm, an area of 41.4cm2. [Hunt and Mashhoudy, 2002] | To better undrestand this term, we show two two graphs and compute their data density. Consider the result of a survey in which the gender, height and weight were recordet for 92 students. Below you see a bar graph showing the breakdown into males and females. The charts are 5.6cm by 7.4cm, an area of 41.4cm2. [Hunt and Mashhoudy, 2002] | ||
[[ | |||
[[Image:Data1.10.gif]] | |||
According the definition you've 2 (female and male) areas with 2 kinds of information (gender and number of students), what makes 4 data points. By deviding this over the size of its area, you get the data tensity of this graph. | According the definition you've 2 (female and male) areas with 2 kinds of information (gender and number of students), what makes 4 data points. By deviding this over the size of its area, you get the data tensity of this graph. | ||
Revision as of 18:33, 28 October 2006
Definition
[Brath, 1997]
Charts and Graphs
In The Visual Display of Graphical Information of Edward Tufte, a milestone in the theory of graph design, principles of graph design are discussed. One of them is: Try to maximise the data density. [Hunt and Mashhoudy, 2002]
While the human eye has the ability to detect large amounts of information within a very small area, statistical graphs often fail to take advantage of this ability. To messure the information content of a graph he definses the data density. [Hunt and Mashhoudy, 2002]
Example
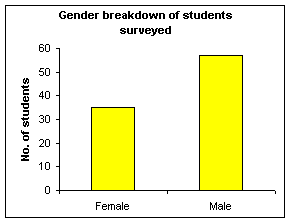
To better undrestand this term, we show two two graphs and compute their data density. Consider the result of a survey in which the gender, height and weight were recordet for 92 students. Below you see a bar graph showing the breakdown into males and females. The charts are 5.6cm by 7.4cm, an area of 41.4cm2. [Hunt and Mashhoudy, 2002]
According the definition you've 2 (female and male) areas with 2 kinds of information (gender and number of students), what makes 4 data points. By deviding this over the size of its area, you get the data tensity of this graph.
number of data points = 4 data density = 4 / 41.4 = 0.1 (to 1 dp) [Hunt and Mashhoudy, 2002]
References
[Barth, 1997] R. Barth. Metrics for effective information visualization. In Proceedings of the 1997 IEEE Symposium on Information Visualization (InfoVis '97), pages 0–108, DC, USA, October 1997. IEEE Computer Society Washington
[Hunt and Mashhoudy, 2002] Neville Hunt and Housh Mashhoudy, Discovering Important Statistical Concepts Using SpreadSheets. Created at: January 29, 2002. Retrieved at: October 28, 2006. http://home.ched.coventry.ac.uk/Volume/vol0/philosop.htm.
