Teaching:TUW - UE InfoVis WS 2006/07 - Gruppe 02 - Aufgabe 3 - Prototype: Difference between revisions
Jump to navigation
Jump to search
| Line 11: | Line 11: | ||
==Implementation Details== | ==Implementation Details== | ||
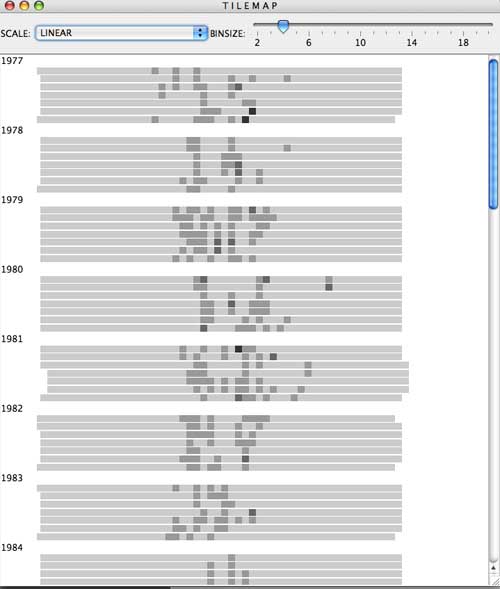
Our prototype parses the input data ( .csv format ), writes the data into a table structure, creates the visualisation and maps the data. The color of each tile depends on the given values. Finally we define interaction and the result is ready to be printed on the screen. | |||
Our example data consists of 3 columns: | |||
1 date | |||
2 time | |||
3 value | |||
Internally we are appending several columns like year, week and many more. | |||
==Screenshot== | ==Screenshot== | ||
| Line 17: | Line 22: | ||
==Used Toolkits== | ==Used Toolkits== | ||
Prefuse Information Visualization Toolkit | * Prefuse Information Visualization Toolkit | ||
==Links== | ==Links== | ||
* [[Teaching:TUW_-_UE_InfoVis_WS_2006/07_-_Gruppe_02|Gruppe 2]] | * [[Teaching:TUW_-_UE_InfoVis_WS_2006/07_-_Gruppe_02|Gruppe 2]] | ||
* [[Teaching:TUW_-_UE_InfoVis_WS_2006/07_-_Gruppe_02_-_Aufgabe_3_-_Technique|Technique]] | * [[Teaching:TUW_-_UE_InfoVis_WS_2006/07_-_Gruppe_02_-_Aufgabe_3_-_Technique|Technique]] | ||
Revision as of 01:47, 5 January 2007
Project TileMap
Authors
Gruppe 02 (Diesenreiter, Weixelbaumer, Felkel, Maier)
Task Description
The task was to implement an application for data visualisation, using the tilemaps technique. Further the java based toolkit prefuse should be used. For further information on this technique, visit our more detailed Tilemap description.
Implementation Details
Our prototype parses the input data ( .csv format ), writes the data into a table structure, creates the visualisation and maps the data. The color of each tile depends on the given values. Finally we define interaction and the result is ready to be printed on the screen. Our example data consists of 3 columns: 1 date 2 time 3 value Internally we are appending several columns like year, week and many more.
Screenshot
Used Toolkits
- Prefuse Information Visualization Toolkit
