Teaching:TUW - UE InfoVis WS 2006/07 - Gruppe 02 - Aufgabe 3 - Prototype: Difference between revisions
No edit summary |
|||
| (43 intermediate revisions by 4 users not shown) | |||
| Line 1: | Line 1: | ||
= | =Project TileMap= | ||
=== | ==Authors== | ||
[[Teaching:TUW - UE InfoVis WS 2006/07 - Gruppe 02|Gruppe 02 (Diesenreiter, Weixelbaumer, Felkel, Maier)]] | |||
=== | ==Task Description== | ||
Our task was to implement an application for visualizing time-dependent data, using the so called tilemap technique. For detailed information on this fascinating technique, you should visit our [[Teaching:TUW_-_UE_InfoVis_WS_2006/07_-_Gruppe_02_-_Aufgabe_3_-_Technique|Tilemap]] description. We were allowed to make use of the powerful java toolkit prefuse, which provides many of the needed functionalities. | |||
==Implementation Details== | |||
Our final prototype parses given input data (provided in .csv files), writes it into table structures and calculates useful information like the adequate week for each entry. Therefor additional columns get appended and are use for our labeling. The visual mapping was realized by dependence of the color of each tile on the given values. Finally we defined basic interaction like zooming and created a simple user interface to control scaling and bucket size of our visualization. Now the result is ready to be printed on screen. | |||
==Screenshot== | |||
[[Image:screen.jpg]] | |||
* | |||
==Used Toolkits== | |||
* Prefuse Information Visualization Toolkit | |||
* | |||
* | ==Links== | ||
* [[Teaching:TUW_-_UE_InfoVis_WS_2006/07_-_Gruppe_02|Gruppe 2]] | |||
* [[Teaching:TUW_-_UE_InfoVis_WS_2006/07_-_Gruppe_02_-_Aufgabe_3_-_Technique|Technique]] | |||
Latest revision as of 02:00, 5 January 2007
Project TileMap[edit]
Authors[edit]
Gruppe 02 (Diesenreiter, Weixelbaumer, Felkel, Maier)
Task Description[edit]
Our task was to implement an application for visualizing time-dependent data, using the so called tilemap technique. For detailed information on this fascinating technique, you should visit our Tilemap description. We were allowed to make use of the powerful java toolkit prefuse, which provides many of the needed functionalities.
Implementation Details[edit]
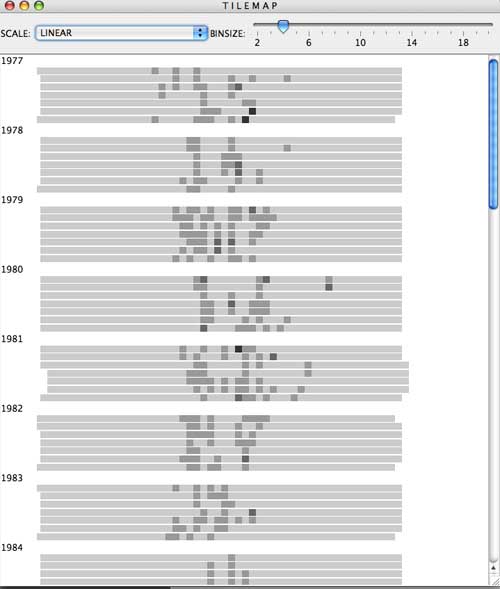
Our final prototype parses given input data (provided in .csv files), writes it into table structures and calculates useful information like the adequate week for each entry. Therefor additional columns get appended and are use for our labeling. The visual mapping was realized by dependence of the color of each tile on the given values. Finally we defined basic interaction like zooming and created a simple user interface to control scaling and bucket size of our visualization. Now the result is ready to be printed on screen.
Screenshot[edit]
Used Toolkits[edit]
- Prefuse Information Visualization Toolkit
