Teaching:TUW - UE InfoVis WS 2006/07 - Gruppe 02 - Aufgabe 2: Difference between revisions
(Removed Spam) |
|||
| (20 intermediate revisions by 5 users not shown) | |||
| Line 10: | Line 10: | ||
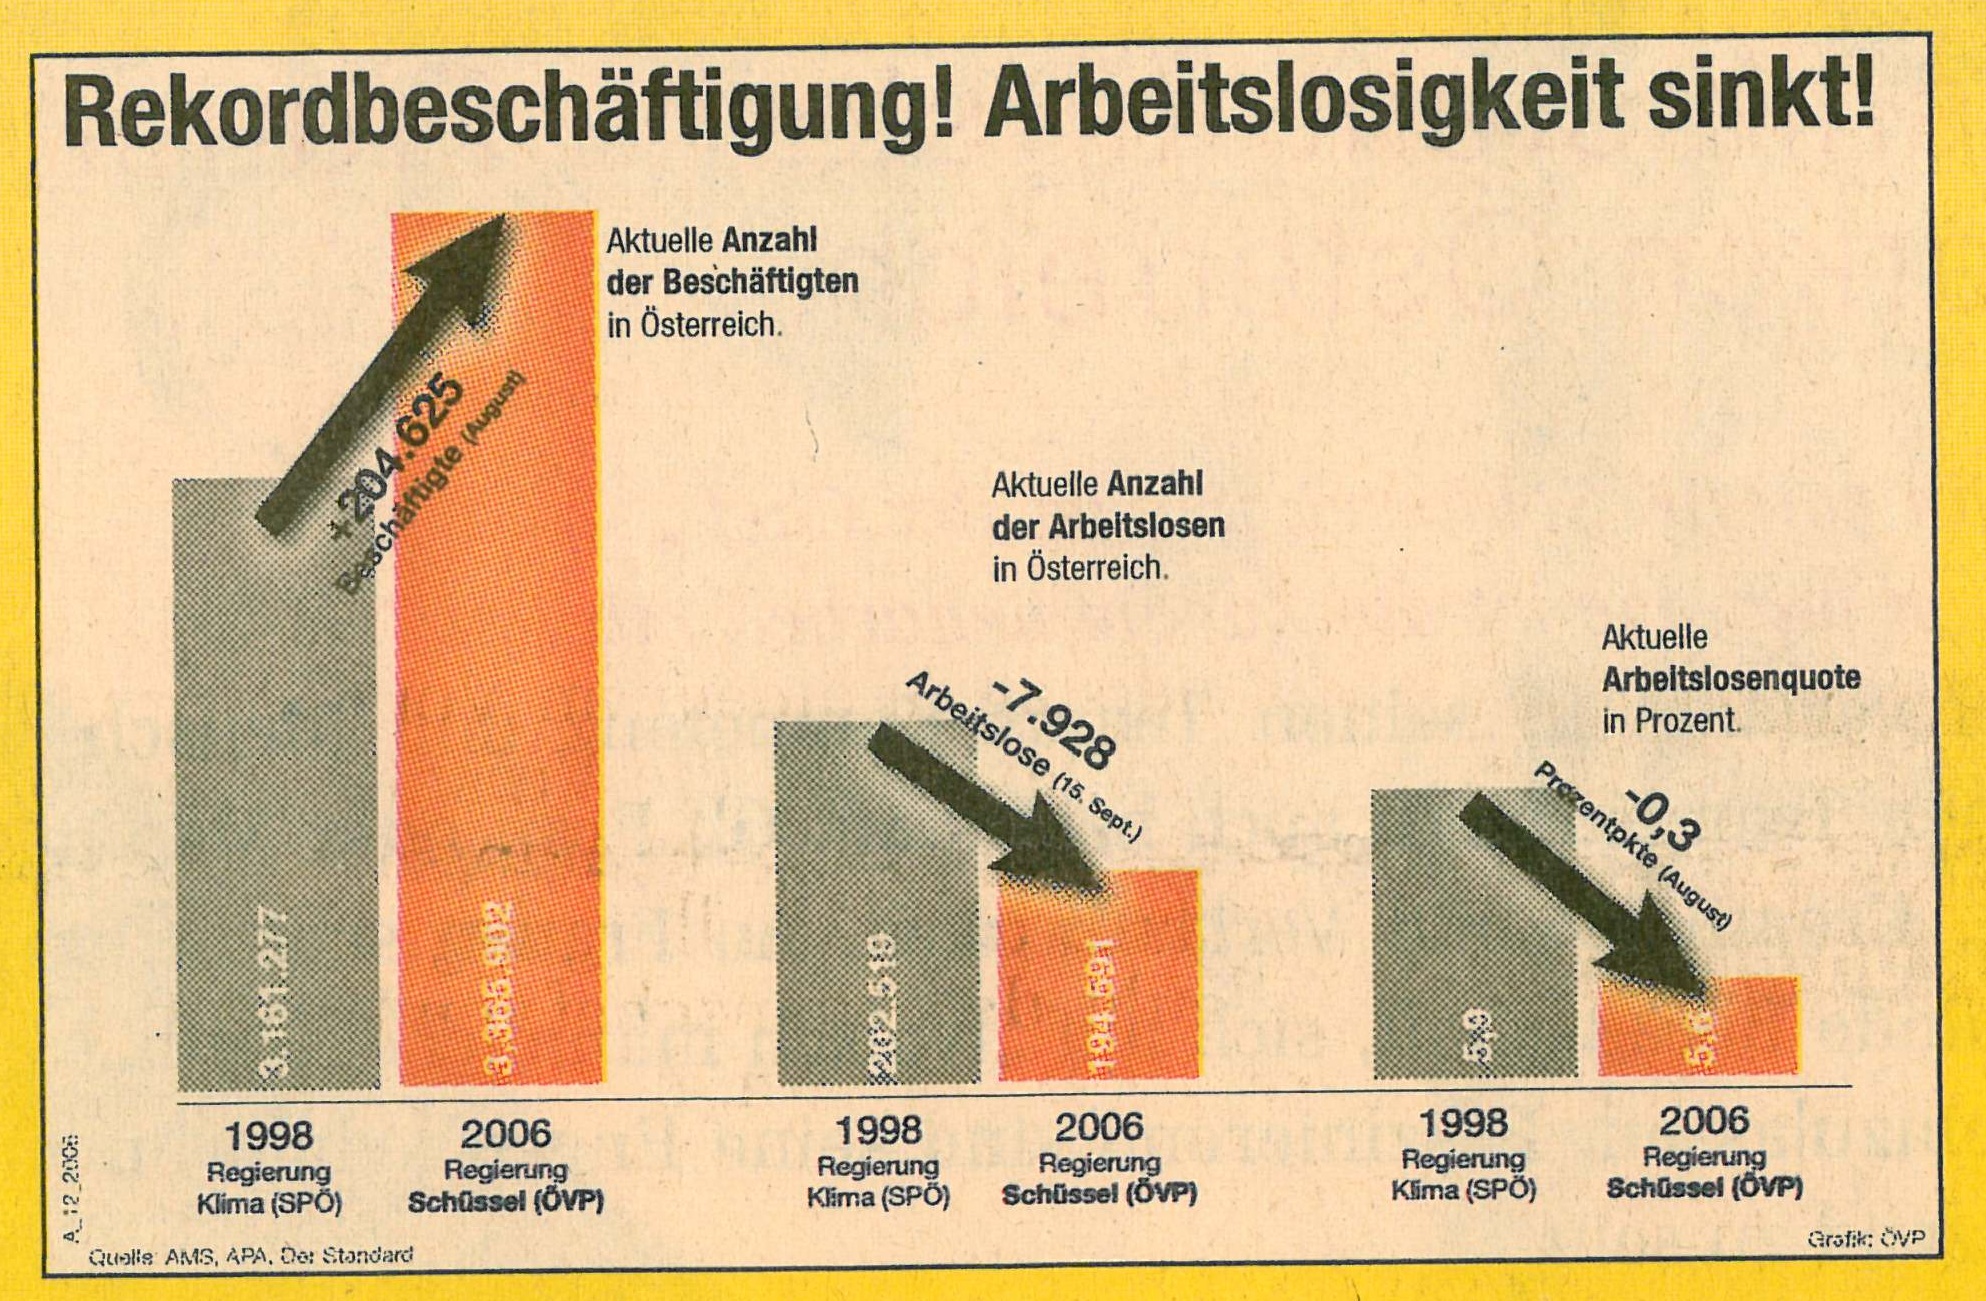
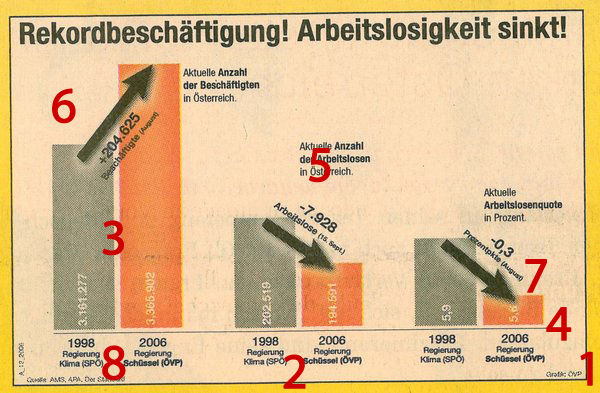
[[Image:Rekordbeschaeftigung_marked_v02.jpg]] | [[Image:Rekordbeschaeftigung_marked_v02.jpg]] | ||
1: The graphic was created for an election campaign, so the creators | 1: The graphic was created for an election campaign, so the creators intent was to beautify the achievements of their party. Perhaps this explains why some (intentional) errors were made. | ||
2: Redundant information: The pairs of bars are color-coded, but still each pair has its own legend ("1998 Regierung Klima (SPÖ)") | 2: Redundant information: The pairs of bars are color-coded, but still each pair has its own legend ("1998 Regierung Klima (SPÖ)"). The extensive use of this redundancy seems to follow some kind of "hammer your message" method. | ||
3: The color-coding of the bars is opposite to the colors that are usually associated with those parties. | 3: The color-coding of the bars is opposite to the colors that are usually associated with those parties. | ||
4: That axis suggests a linear order in time to the pairs of bars. | 4: That axis suggests a linear order in time to the pairs of bars. In combination with the graphic's header ("Rekordbeschäftigung! Arbeitslosigkeit sinkt!) on first sight it seems the whole graphic just shows the number of jobless people over a period of time time. The continuous horizontal line suggests an axis and emphasizes this impression. | ||
5: These explanations are too long, and wrong | 5: These explanations are too long, and wrong too. Wrong, because the numbers from 1998 are not up-to-date anymore. Instead of "Aktuelle Anzahl der Arbeitslosen in Österreich" one could simply write "Arbeitslose", because from the context it's also clear that these numbers describe the number of unemployed people in Austria, not somewhere else. | ||
6: "Lie Factor": | 6: "Lie Factor": The actual increase of the number of "Beschäftigte" is about 6.5%, whereas in the graphical representation that increase is about 43%. For the other two pairs that factor is similarily too high. | ||
7: " | 7: "Prozentpukte" could be articulated shorter ("%"). | ||
8: Different formatting for the same class of nouns ("Klima" non-bold; "Schüssel" bold) | 8: Different formatting for the same class of nouns ("Klima" non-bold; "Schüssel" bold) to set value on the own party. | ||
== Redesign of the Graphic == | == Redesign of the Graphic == | ||
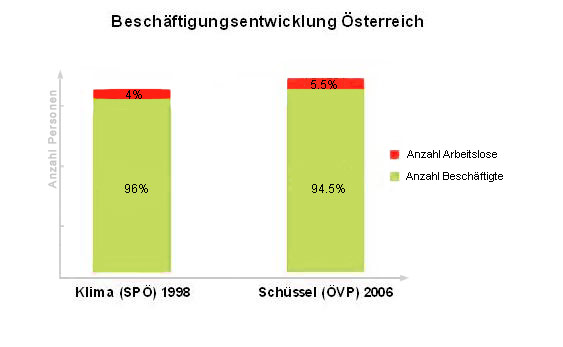
[[Image: | [[Image:Beschaeftigung_Oesterreich_v03.jpg]] | ||
The intention of the original graphic was to show that the workplace-politics of Schüssel (ÖVP) 2006 was better than that of Klima (SPÖ) 1998. | The intention of the original graphic was to show that the workplace-politics of Schüssel (ÖVP) 2006 was better than that of Klima (SPÖ) 1998. | ||
| Line 39: | Line 38: | ||
Our graphic has all that information in a very compact way. There | Our graphic has all that information in a very compact way. There are the procentual numbers of employed and unemployed under the two chancelors, the rate of unemployment is shown implicitly by the length of the bars. | ||
(!We take no warranty for the correctness of the featured numbers!) | (!We take no warranty for the correctness of the featured numbers!) | ||
Latest revision as of 20:25, 26 May 2009
Poor Graphic[edit]

Why is this a poor Graphic ?[edit]
1: The graphic was created for an election campaign, so the creators intent was to beautify the achievements of their party. Perhaps this explains why some (intentional) errors were made.
2: Redundant information: The pairs of bars are color-coded, but still each pair has its own legend ("1998 Regierung Klima (SPÖ)"). The extensive use of this redundancy seems to follow some kind of "hammer your message" method.
3: The color-coding of the bars is opposite to the colors that are usually associated with those parties.
4: That axis suggests a linear order in time to the pairs of bars. In combination with the graphic's header ("Rekordbeschäftigung! Arbeitslosigkeit sinkt!) on first sight it seems the whole graphic just shows the number of jobless people over a period of time time. The continuous horizontal line suggests an axis and emphasizes this impression.
5: These explanations are too long, and wrong too. Wrong, because the numbers from 1998 are not up-to-date anymore. Instead of "Aktuelle Anzahl der Arbeitslosen in Österreich" one could simply write "Arbeitslose", because from the context it's also clear that these numbers describe the number of unemployed people in Austria, not somewhere else.
6: "Lie Factor": The actual increase of the number of "Beschäftigte" is about 6.5%, whereas in the graphical representation that increase is about 43%. For the other two pairs that factor is similarily too high.
7: "Prozentpukte" could be articulated shorter ("%").
8: Different formatting for the same class of nouns ("Klima" non-bold; "Schüssel" bold) to set value on the own party.
Redesign of the Graphic[edit]
The intention of the original graphic was to show that the workplace-politics of Schüssel (ÖVP) 2006 was better than that of Klima (SPÖ) 1998. This was demonstrated by
- the (absolut) number of people with a job and the increase of that number,
- the number of jobless people and the decrease,
- the rate of unemployment,
- some big arrows showing increases and decreases
Our graphic has all that information in a very compact way. There are the procentual numbers of employed and unemployed under the two chancelors, the rate of unemployment is shown implicitly by the length of the bars.
(!We take no warranty for the correctness of the featured numbers!)
Notes[edit]
Es fällt schnell ins Auge, daß diese Grafik sehr geeignet für den Wahlkampf zu sein scheint. Unter diesem Gesichtspunkt handelt es sich um eine ausgezeichnete Grafik, die allerdings den Eindruck des Betrachters verfälschen kann. Zwar hat eine Senkung der Arbeitslosigkeit stattgefunden, jedoch wurde es hier stark verstärkt und verzerrt.
Auffällig ist eine Suggerierung eines zeitlichen Ablaufs an der X-Achse der Grafik, wobei hier bloß unterschiedliche Ansichten desselben Problems gezeigt werden. Bei schnellem Betrachten ergibt sich der Eindruck einer zuerst ansteigenden und schliesslich stark fallenden Kurve, wobei dies schnell als Vorher (SPÖ) und Nachher (ÖVP) interpretiert wird. Bei genauerem Hinsehen bemerkt man, daß ganz links bloß die Anzahl der Beschäftigten, mittig die Anzahl der Arbeitslosen und rechts das Verhältnis beider dargestellt ist, jeweils zwischen demselben Zeitraum von 1998 und 2006.
Es handelt sich hier also um drei separate Balkendiagramme, durch deren Anordnung der Eindruck einer stark sinkenden Arbeitslosigkeit entsteht. Unterstützt wird dies durch den durchgehenden Strich, auf dem alle drei Diagramme platziert sind, anstatt sie optisch voneinander zu trennen. Die Platzierung der verhältnismässig riesigen Beschäftigungszahlen zur linken bildet den Ausgangspunkt für die stark fallende Kurve, welche durch die Pfeile zusätzlich verdeutlicht wird (sieht einem Roller Coaster sehr ähnlich).
Weiters sind die Größenverhältnisse der einzelnen Vorher-Nachher Unterschiede stark verfälscht. Im linken Diagramm ergibt sich der Eindruck eines Anstiegs um fast die Hälfte (ca. 43%), wobei es sich tatsächlich nur um wenige Bildpunkte Unterschied handeln sollte (ca. 6.5%). Auch die Verhältnisse der gesamten Diagramme untereinander ist nicht einheitlich, so werden rechts auch die sinkenden Arbeitslosen stark vergrößert.
Die Farbbelegung der Diagrammbalken entspricht nicht ganz der Zuordnung der üblichen Parteifarben, in diesem Fall wurden diese sogar komplett vertauscht. Das macht das Ganze weniger schnell verständlich, da die meisten Betrachter die Farben sofort mit den entsprechenden Parteien assoziieren. Der Grund dafür ist uns ehrlich gesagt recht schleierhaft, es liegt jedoch nahe, daß mit schwarzen Balken wohl selten positive Entwicklungen besetzt werden.

